
Gold Below $4,000: The $3,900 Rebound Is an Oil Story, Not a Fed Story
XAU/USD · Bearish bias, tactical | Daily chart
Friday’s candle did real damage. Spot gold fell 3.5% to about $3,880 — a 13-month low — and lost roughly 6% in October, its worst October since 2008. Silver broke $50 for the first time since November 2025 and shed nearly 18% on the month. Bullion now sits about 28% below its January 28 record close of $5,419.83.
Then Monday bounced. Gold recovered to the $3,900 - 3,940 area, silver back above $50, and the reflexive take is “the Fed blinked.”
My read is different: nothing about the Fed changed. Oil did.
🌍 Why now
The October liquidation came from two directions, and only one of them was technical. First, the Iran conflict and the Strait of Hormuz tanker attack pushed Brent above $100, dragging energy costs into the inflation arithmetic. US headline CPI ran at 3.7% in September, the Fed hiked in September for the first time since 2023, held in October with a hawkish tilt, and the market still prices a greater than 70% chance of a December hike. The 10-year sits near 4.94%.
Second, the AI-capex unwind hit tech, forced de-risking, and gold got sold as collateral — not as a haven. That is the tell. When the shock is inflationary, gold stops behaving like protection and starts behaving like a risk asset.
Monday’s bounce came from headlines about US–Iran diplomacy and a 3%+ slide in crude. That is an inflation story being repriced, not a policy pivot. With midterms this week and payrolls on Friday, the macro tape stays live — which is exactly why this level matters now.
📊 What the chart says
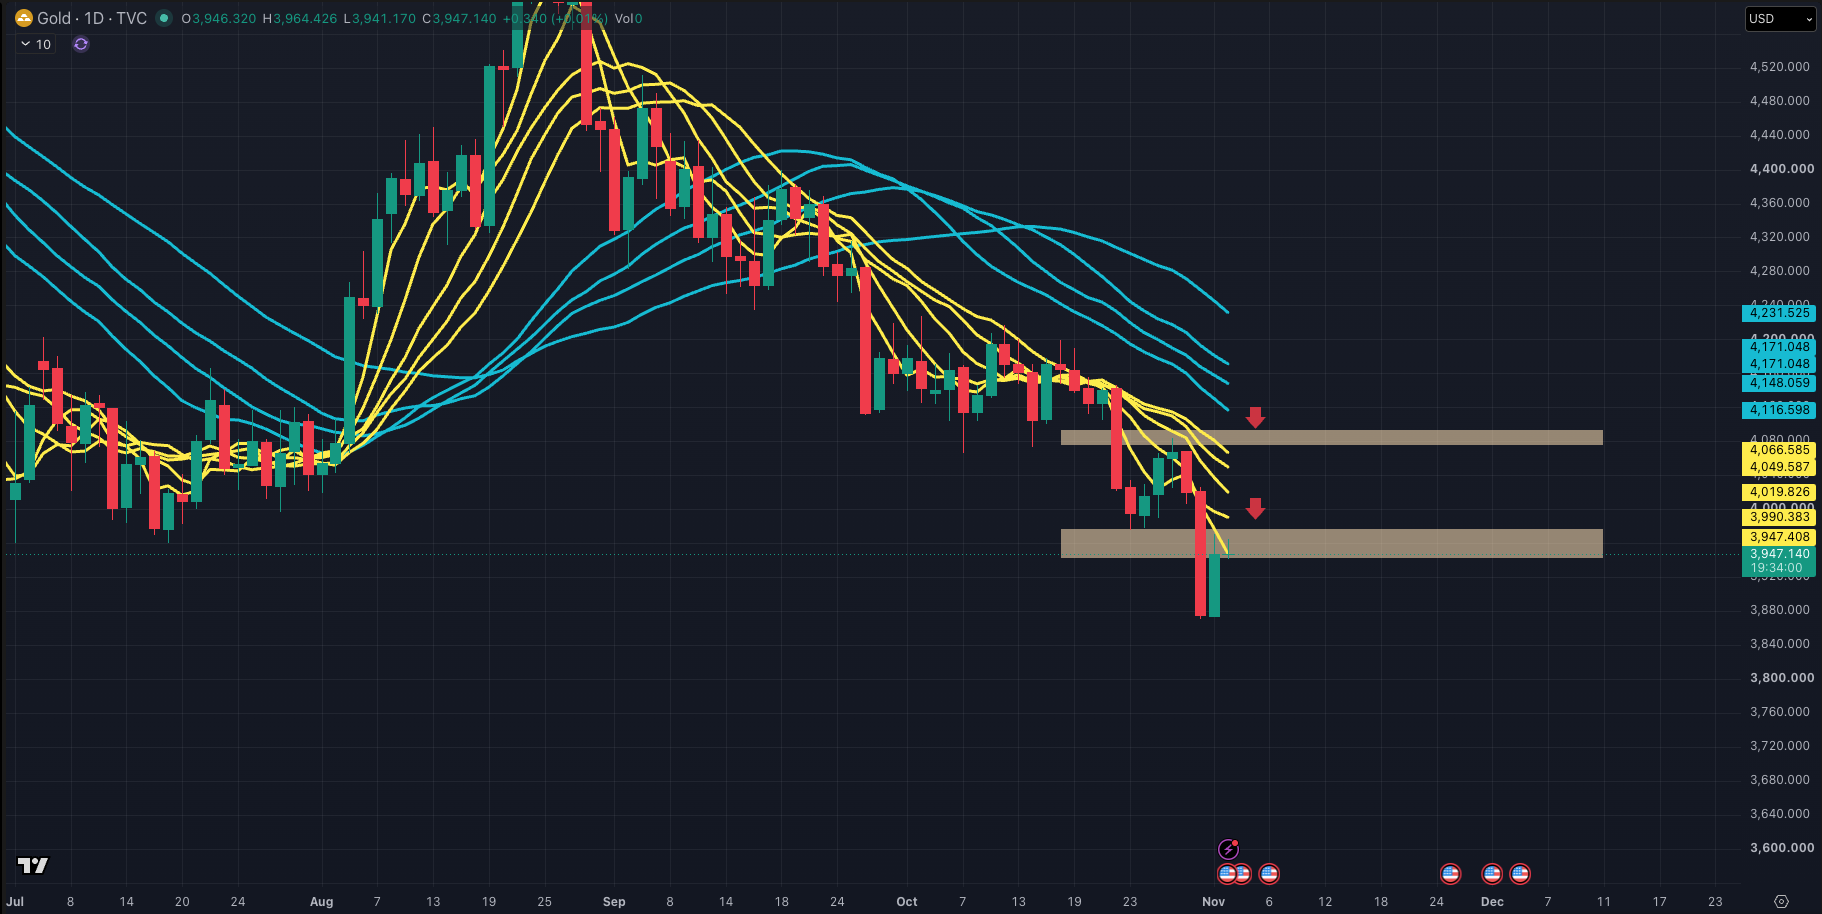
The daily structure is lower highs, lower lows, price under a downward-sloping moving-average cluster, and two broken floors: $4,000 and the $3,946 - 3,989 shelf.
That shelf is my first decision zone. A bounce that stalls there — especially one that fails to reclaim $4,000 — keeps the trend intact and favors another leg lower. Below that, $3,880 is the immediate reference, then $3,840, with $3,800 in play if selling accelerates.
The upside map is cleaner. $4,065 - 4,100 is the second resistance band; a daily close above it would neutralize my near-term bearish view. Above roughly $4,116, I reassess the whole structure rather than defend a thesis.
Silver confirms the defensive tone: sub-$50 pricing and a gold-to-silver ratio near 79 say this is a metals-wide de-risking, not a gold-specific flush.
⚠️ The other side
This is not a one-way trade. Sucden Financial expects gold to test $3,900 into the December meeting but sees a recovery to $4,200 - 4,300 by mid-January as tightening peaks. Central-bank buying has historically strengthened into sub-$4,000 prints, and after a 6% monthly drop, oversold conditions make short-covering violent.
The real invalidation risk is diplomatic, not monetary: a credible US–Iran deal would collapse crude, ease the inflation premium, and let gold rally on rate relief instead of falling on it.
🎯 How I’m trading it
I favor selling failed rebounds into $3,946 - 3,989 rather than chasing a market already $500 off its high. Bias stays bearish while $4,000 caps. I stand down above $4,065 - 4,100, and I abandon the short thesis above $4,116.
Two things to watch alongside price: Brent’s reaction to Iran headlines, and December FOMC odds. If oil keeps sliding and gold cannot hold $3,900, the bounce was a reprieve, not a reversal.
For traders expressing this through a gold CFD, including where available on Bitget, the invalidation level and position size matter far more than leverage. CFDs amplify losses as readily as gains. This is analysis, not advice.
All trading education provided by Bitget is for educational purposes only and should not be considered financial advice. The strategies and examples shared are for reference only and may not reflect actual market conditions. CFD trading involves significant risk, including the potential loss of capital. Past performance does not guarantee future results. Please conduct thorough research and ensure that you understand the risks involved. Bitget is not responsible for any trading decisions made by users.


- XAU/USD · Bearish bias, tactical | Daily chart
- 🌍 Why now
- 📊 What the chart says
- ⚠️ The other side
- 🎯 How I’m trading it