
Bitcoin Price Consolidates Losses, Why 100 SMA Is The Key To Recovery
Bitcoin price is struggling below the $43,500 resistance zone. BTC could start another decline if it stays below the 100 hourly SMA.
- Bitcoin price started a major decline from the $49,000 resistance zone.
- The price is trading below $43,250 and the 100 hourly Simple moving average.
- There is a key declining channel forming with resistance near $43,050 on the hourly chart of the BTC/USD pair (data feed from Kraken).
- The pair could start a fresh decline if it stays below the $43,250 resistance zone.
Bitcoin Price Turns Red
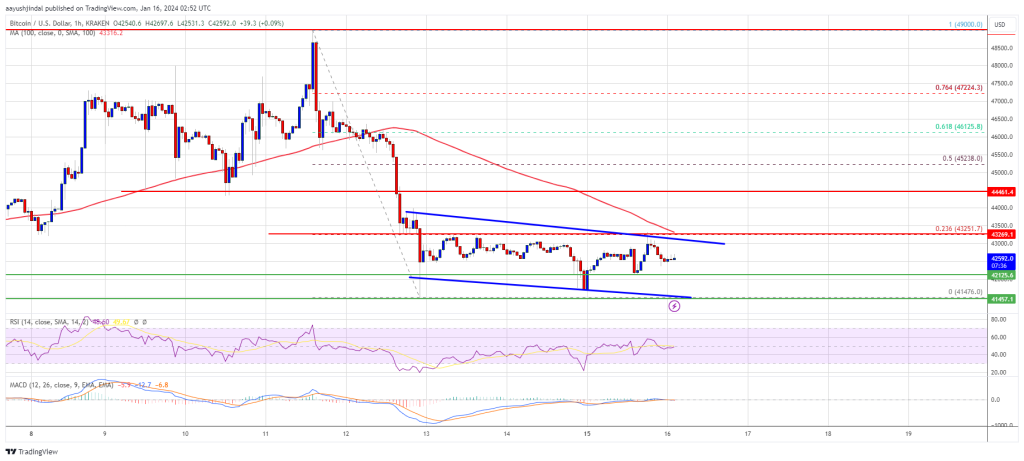
Bitcoin price started a major decline from the $49,000 resistance zone . BTC traded below the $46,500 and $45,000 support levels to enter a short-term bearish zone.
The bears even pushed the price below the $42,500 support zone before the bulls appeared. A low was formed near $41,476 and the price is now consolidating losses. It recovered a few points above the $42,000 level. The price tested the 23.6% Fib retracement level of the key drop from the $49,000 swing high to the $41,476 low.
Bitcoin is now trading below $43,250 and the 100 hourly Simple moving average . There is also a key declining channel forming with resistance near $43,050 on the hourly chart of the BTC/USD pair.
On the upside, immediate resistance is near the $43,000 level and the channel zone. The first major resistance is $43,250 or the 100 hourly Simple moving average. A clear move above the $43,250 resistance could send the price toward the $44,450 resistance.
Source: BTCUSD on TradingView.com
The next resistance is now forming near the $45,250 level. It is near the 50% Fib retracement level of the key drop from the $49,000 swing high to the $41,476 low. A close above the $45,250 level could start a strong increase and send the price higher. The next major resistance sits at $47,000.
More Losses In BTC?
If Bitcoin fails to rise above the $43,250 resistance zone, it could start a fresh decline. Immediate support on the downside is near the $42,120 level.
The next major support is $41,500. If there is a close below $41,500, the price could gain bearish momentum. In the stated case, the price could drop toward the $40,000 support in the near term.
Technical indicators:
Hourly MACD – The MACD is now losing pace in the bearish zone.
Hourly RSI (Relative Strength Index) – The RSI for BTC/USD is now below the 50 level.
Major Support Levels – $42,120, followed by $41,500.
Major Resistance Levels – $43,050, $43,250, and $44,450.
Disclaimer: The content of this article solely reflects the author's opinion and does not represent the platform in any capacity. This article is not intended to serve as a reference for making investment decisions.
You may also like
Assessing if Avalanche’s growing network activity can spur AVAX’s price recovery

Berkshire's stock hits a new high amid tech plunge as return to yen bonds sparks heated "increase positions in Japan" discussion
Berkshire Hathaway has hired banks to prepare for its first yen bond issuance since April, aiming to raise more funds in Japan. According to sources familiar with the matter, Berkshire has mandated Mizuho Securities and Bank of America Securities for a potential benchmark yen bond issuance, which is expected to take place in the near future, though the exact timing will depend on market conditions.
Nomura's monopoly is being challenged! Mizuho (MFG.US) is reshaping Japan's underwriting landscape with global IPOs
Mizuho is establishing a solid foothold in Japan's equity capital market by leveraging a unique and highly profitable track: on one hand, it is tapping into the strong demand for AI financing from the US market, and on the other, connecting with the vast domestic household savings in Japan.

Crypto prices
More


