
Ethereum Price Trims Gains But 100 SMA Could Trigger Fresh Increase
Ethereum price extended its increase above the $2,320 resistance zone. ETH is correcting gains but the 100 hourly SMA might provide support and start a fresh increase.
- Ethereum started an extended recovery wave above the $2,320 resistance zone.
- The price is trading above $2,300 and the 100-hourly Simple Moving Average.
- There was a break below a key bullish trend lien with support at $2,325 on the hourly chart of ETH/USD (data feed via Kraken).
- The pair might start a fresh increase if it manages to stay above the $2,300 level.
Ethereum Price Holds Support
Ethereum price remained in a positive zone above the $2,250 resistance zone. ETH cleared the $2,320 resistance to move further into a positive zone, outperforming Bitcoin .
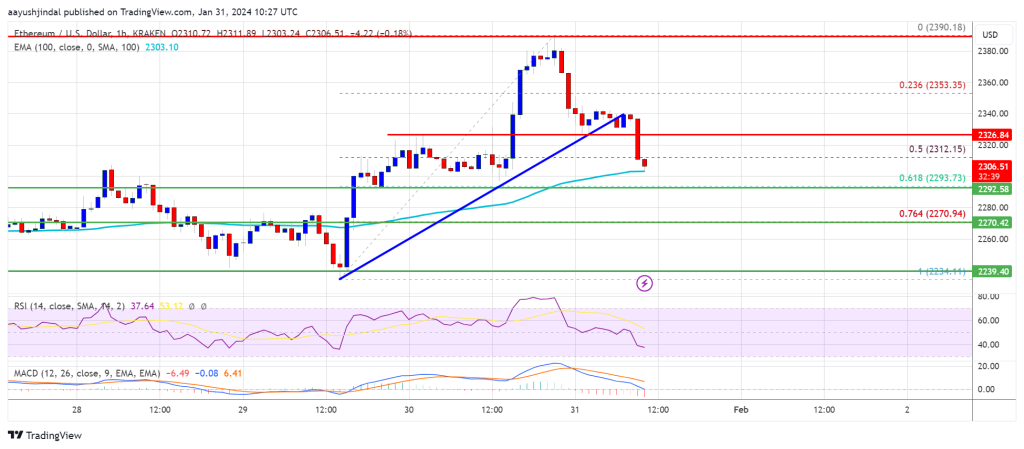
The price traded close to the $2,400 level. A high was formed near $2,390 and the price is now correcting gains. There was a move below the $2,350 level. The price broke the 50% Fib retracement level of the upward move from the $2,235 swing low to the $2,390 high.
Besides, there was a break below a key bullish trend lien with support at $2,325 on the hourly chart of ETH/USD. However, Ethereum is still above $2,300 and the 100-hourly Simple Moving Average .
Source: ETHUSD on TradingView.com
On the upside, the first major resistance is near the $2,325 level. The next major resistance is near $2,350, above which the price might rise and test the $2,400 resistance. If the bulls push the price above the $2,400 resistance, they could aim for $2,450. A clear move above the $2,450 level might send the price further higher. In the stated case, the price could rise toward the $2,550 level.
More Losses in ETH?
If Ethereum fails to clear the $2,325 resistance, it could continue to move down. Initial support on the downside is near the $2,300 level and the 100 hourly SMA.
The next key support could be the $2,295 zone or the 61.8% Fib retracement level of the upward move from the $2,235 swing low to the $2,390 high. A daily close below the $2,295 support might start another steady decline. In the stated case, Ether could test the $2,200 support. Any more losses might send the price toward the $2,120 level.
Technical Indicators
Hourly MACD – The MACD for ETH/USD is gaining momentum in the bearish zone.
Hourly RSI – The RSI for ETH/USD is now below the 50 level.
Major Support Level – $2,300
Major Resistance Level – $2,325
Disclaimer: The content of this article solely reflects the author's opinion and does not represent the platform in any capacity. This article is not intended to serve as a reference for making investment decisions.
You may also like
Will the Fed "continue raising interest rates"? Will the "tightening cycle" of the late 1980s be repeated?
The Citi report points out that the current macro environment is highly similar to the tightening cycle of 1988-1989, when the economy remained resilient and inflation pressures gradually accumulated, followed by a slowdown in economic activity before policies shifted to easing. During that tightening cycle, the Federal Reserve raised interest rates 16 times in a row.
Rare alliance of arch-rivals! Musk and Altman support Dario Amodei's call to "slow down AI globally"
Anthropic's Amodei issued a call to "slow down AI globally," and to everyone's surprise, rivals Musk and Altman both publicly endorsed the initiative. The three industry giants unanimously agreed to grant third-party access to "employee-level" evaluation rights and to implement coordinated deceleration measures. Altman went further, announcing that OpenAI will not IPO this year. The resignation of a researcher and a collective breakout of uncontrollable AI systems have ignited long-standing industry fears.
Bitcoin vs Ethereum ETFs: Which asset is winning September’s flow battle?
Solana targets $147 as it breaks key resistance and eyes further gains
Crypto prices
More


