
Ethereum Price Faces Big Move – Can Bulls Send ETH To $2,500?
Ethereum price gained traction and climbed above $2,350. ETH is now showing positive signs and might extend gains toward the $2,500 level.
- Ethereum is gaining bullish momentum above the $2,350 zone.
- The price is trading above $2,320 and the 100-hourly Simple Moving Average.
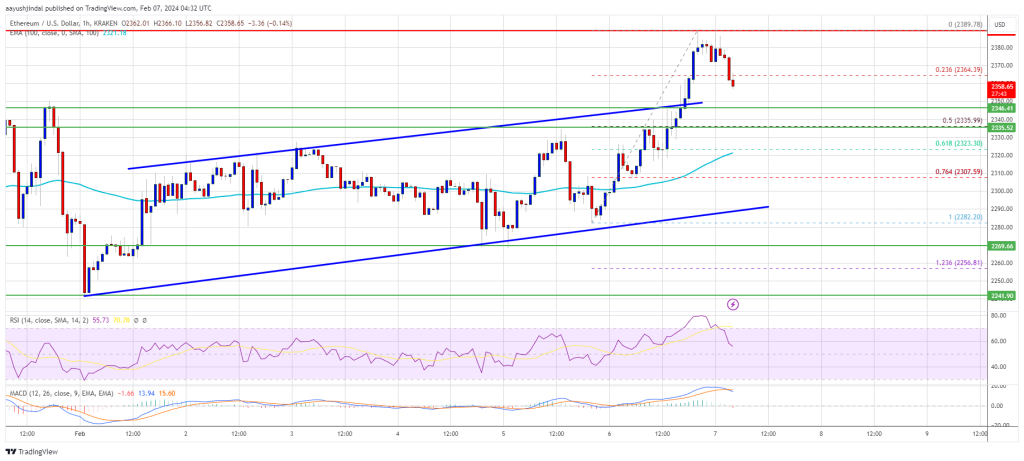
- There was a break above a key rising channel forming with resistance near $2,350 on the hourly chart of ETH/USD (data feed via Kraken).
- The pair might correct lower, but dips could be limited below the $2,335 support zone.
Ethereum Price Turns Green
Ethereum price formed a base above the $2,220 level and started a decent increase. ETH outperformed Bitcoin and was able to clear a few hurdles near the $2,350 level.
There was a break above a key rising channel forming with resistance near $2,350 on the hourly chart of ETH/USD. The bulls pumped the pair toward the $2,400 level. A high was formed near $2,389 and the price is now consolidating gains.
There was a minor decline below the $2,365 level. Ether dipped below the 23.6% Fib retracement level of the recent increase from the $2,282 swing low to the $2,389 high.
Ethereum is now trading above $2,320 and the 100-hourly Simple Moving Average. On the upside, the first major resistance is near the $2,380 level. The next major resistance is near $2,420, above which the price might rise and test the $2,485 resistance.
Source: ETHUSD on TradingView.com
If the bulls remain in action, they could even pump the price above the $2,550 resistance. In the stated case, the price could rise toward the $2,550 level.
Another Drop in ETH?
If Ethereum fails to clear the $2,380 resistance, it could start a downside correction. Initial support on the downside is near the $2,350 level and the channel trend line.
The next key support could be the $2,335 zone or the 50% Fib retracement level of the recent increase from the $2,282 swing low to the $2,389 high. A clear move below the $2,335 support might send the price toward $2,250. The main support could be $2,220. Any more losses might send the price toward the $2,120 level.
Technical Indicators
Hourly MACD – The MACD for ETH/USD is losing momentum in the bullish zone.
Hourly RSI – The RSI for ETH/USD is now above the 50 level.
Major Support Level – $2,335
Major Resistance Level – $2,380
Disclaimer: The content of this article solely reflects the author's opinion and does not represent the platform in any capacity. This article is not intended to serve as a reference for making investment decisions.
You may also like
Anthropic signs $13.7 billion computing power agreement with "Trump-linked company" Rum Group
Anthropic has signed a $13.7 billion, six-year computing power agreement with Rum Group. The core of the agreement is a data center under construction in Georgia. Rum Group was formerly the conservative video platform Rumble, whose early investors include current U.S. Vice President Vance.
Will the midterm elections cause the US stock market to crash? 75 years of history give an unexpected answer
Currently, with less than eight weeks until the midterm elections, one of the greatest uncertainties facing Wall Street is imminent. But will the reshuffling of power in Congress lead to a stock market crash? Looking back over 75 years of history, the answer is surprising, and ultimately leans toward optimism.

New Zealand Dollar weakens below 0.5800 on RBNZ dovish signals
Crypto prices
More


