Bitget App
Trade smarter
Buy cryptoMarketsTradeFuturesEarnAISquareMore
BTC on-chain indicator hits bottom! LTH/STH ratio returns to bull market starting point
BTC on-chain indicator hits bottom! LTH/STH ratio returns to bull market starting point

CryptoChan2024/12/21 05:47
By:CryptoChan
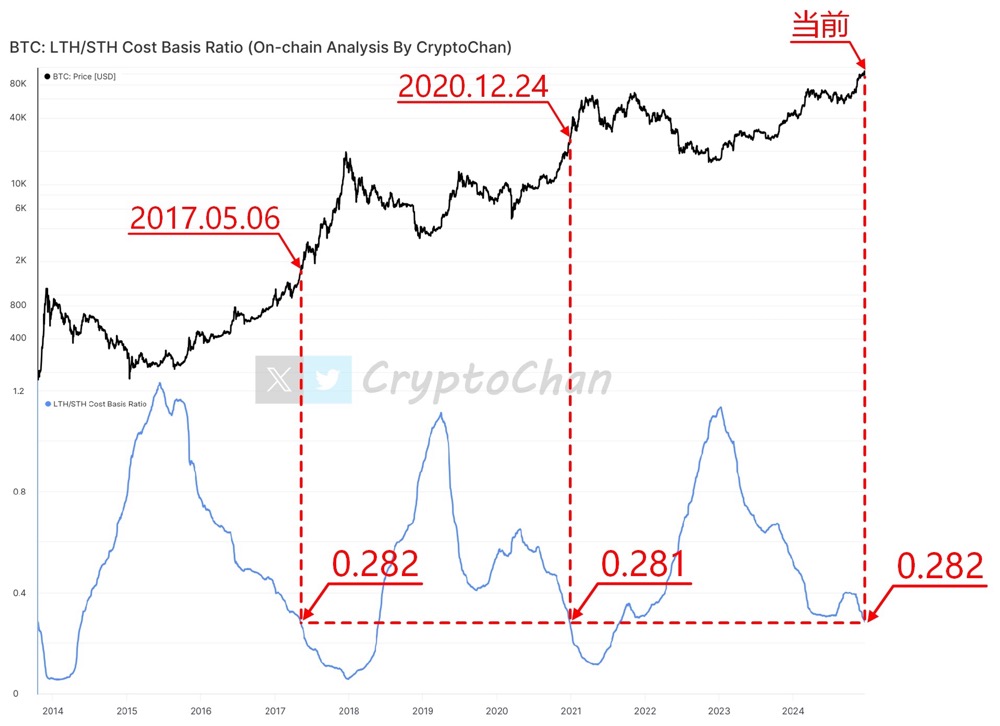
According to on-chain analyst CryptoChan, the ratio of the average price of Bitcoin long-term holders (LTH) to short-term holders (STH) chips (LTH/STH cost benchmark ratio) has now dropped to 0.282 , which has been an important signal for the starting point of the bull market in history.
 
On May 6, 2017, after the indicator touched 0.282, the price of Bitcoin started around $1,500 and eventually reached a high of nearly $20,000 by the end of the year.
On December 24, 2020, the indicator fell to 0.281 again, and then Bitcoin ushered in a super bull market where the price broke through from $20,000 to $60,000;
Currently, the indicator has fallen back to 0.282 for the third time, and the trigger of this key area is highly similar to the starting point of the previous bull market.
 
The upper part of the chart shows the price trend of Bitcoin, and the shows the ratio indicator of "average buying price of long-term holders' chips" and "average buying price of short-term holders' chips". Current data indicates that the Bitcoin market is replicating the chip distribution status before the launch of the past two bull markets, which may imply an imminent price change.
BTC on-chain indicator hits bottom! LTH/STH ratio returns to bull market starting point image 0
8
19

Disclaimer: The content of this article solely reflects the author's opinion and does not represent the platform in any capacity. This article is not intended to serve as a reference for making investment decisions.

Understand the market, then trade.
Bitget offers one-stop trading for cryptocurrencies, stocks, and gold.
Trade now!

You may also like

As the 10-year US Treasury yield breaks above 5% and Japanese bond yields fall below 3%, global bond market pressure surges!

Global bond markets are sounding the alarm as US Treasury yields break 5%, reaching their highest level since 2007, and Japanese bond yields hit a 30-year high. Soaring oil prices, persistent inflation, and mounting debt are triggering a wave of sell-offs. Institutions warn: 5% is by no means the endpoint—6% is now in sight! With US and Japan central bank decisions imminent this week, a more intense asset storm may just be beginning.

华尔街见闻2026/09/15 07:56