
Stellar (XLM) Price Prediction: Is XLM Poised for a Rebound or More Downside?

Stellar (XLM) has experienced a significant price movement over the past few months, first rallying strongly in late 2024 before entering a prolonged correction phase. After reaching a high near $0.60, XLM has since retraced, recently finding support around $0.28-$0.30. However, with a slight 6.50% bounce in the latest session, traders are now asking: Is Stellar about to break out of its downtrend, or is this just a temporary relief rally before another leg down?
This StellAR price prediction will explore key support and resistance levels, technical indicators, and potential price scenarios to determine whether XLM can sustain its recovery or if further declines are ahead.
Stellar Price Prediction: Is XLM Showing Signs of Recovery?
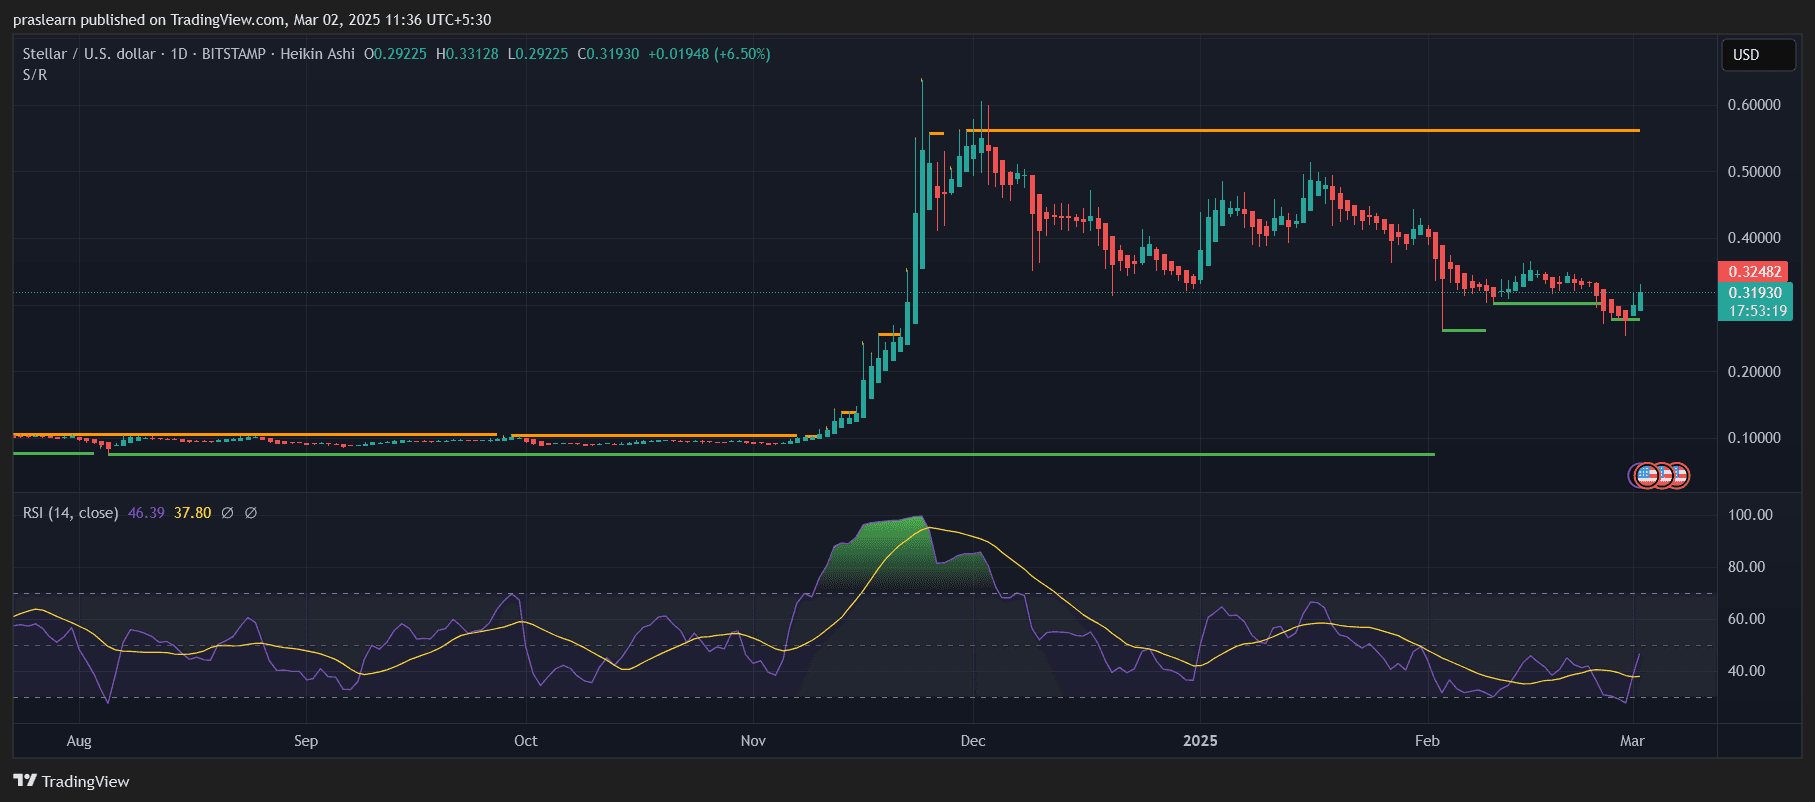 XLM/USD Daily Chart- TradingView
XLM’s latest price movement suggests early signs of a possible recovery, as the coin has bounced from its recent support zone around $0.28-$0.30 and is now trading around $0.3193. The 6.50% daily increase could indicate renewed buying interest, but the overall structure remains cautiously bearish, with lower highs and lower lows still intact.
One crucial factor to watch is whether this bounce can hold. If XLM can sustain gains and establish higher support, it might signal the start of a trend reversal. However, if selling pressure increases at key resistance levels, this move could turn into another bull trap before further declines.
What Is the RSI Indicating About XLM’s Momentum?
The Relative Strength Index (RSI) is currently at 46.39, a notable recovery from its recent lows. Although this suggests that XLM price is no longer in oversold territory, it remains below the 50-neutral level, meaning bullish momentum is not yet confirmed.
For a true reversal, the RSI needs to break above 50 and sustain a higher trend, signaling that buyers are taking control. If RSI remains under 50, XLM might continue consolidating or even retest lower supports before attempting a stronger rally.
What Are the Key Support and Resistance Levels?
Support Levels:
The most critical immediate support for XLM is around $0.28-$0.30, where the price recently bounced. If this level holds, XLM could build a base for further upward movement. However, a break below this range would expose the next major support at $0.20, which served as a previous accumulation zone before the November rally.
Resistance Levels:
On the upside, XLM must clear $0.35-$0.38 to confirm a bullish breakout. This region has acted as strong resistance during the recent downtrend, rejecting price recovery attempts. A decisive close above $0.38 could trigger a move toward $0.45, the next major resistance.
Beyond $0.45, the ultimate resistance stands at $0.60, where XLM last peaked. Breaking past this level would indicate a full trend reversal, paving the way for a potential rally toward new highs.
XLM Price Prediction: Can XLM Sustain Its Rally or Will It Face Another Rejection?
While today’s bounce is encouraging, XLM still faces strong resistance ahead . For a bullish continuation, the price must break above $0.35-$0.38 and establish it as a new support zone. If buying pressure continues and volume increases, XLM could attempt a run toward $0.45 and beyond.
However, failure to break above resistance levels could result in another rejection, sending XLM back toward its $0.28-$0.30 support. A breakdown below this level would open the door for further losses toward $0.20, delaying any potential bullish recovery.
What’s the Outlook for Stellar Price in the Coming Weeks?
Given the current market conditions, two possible scenarios could unfold:
- Bullish Scenario: If XLM price holds above $0.30 and breaks past $0.38, a bullish move toward $0.45-$0.50 could follow. Sustained volume and RSI moving above 50 would support this case.
- Bearish Scenario: If XLM price fails to break resistance and drops below $0.28, the next target would be $0.20, signaling continued weakness in the market.
XLM Price Prediction: Will Stellar (XLM) Continue Rising or Fall Further?
Stellar price is currently at a crucial turning point , attempting to recover after a prolonged correction. While today’s 6.50% bounce suggests renewed buying interest, strong resistance at $0.35-$0.38 remains a major hurdle.
For XLM to confirm a trend reversal, it must sustain higher price action and break key resistance zones. Until then, the market remains in a wait-and-see mode, with the risk of further downside still present.
Traders should keep an eye on volume, RSI movement, and price action near support and resistance zones to assess XLM’s next potential move. Will Stellar reclaim its bullish momentum, or is another leg down on the horizon? The next few weeks will be critical in shaping XLM’s future trend.
Disclaimer: The content of this article solely reflects the author's opinion and does not represent the platform in any capacity. This article is not intended to serve as a reference for making investment decisions.
You may also like
STRK Breakout Now Depends on $0.05 Support Holding
NEAR Loses Critical $5 Level After Brutal $20M Long Squeeze: More Pain Ahead?
If US Treasury yields continue to rise, what will Washington do next?
The Treasury has maintained liquidity by increasing the issuance of short-term Treasury bills and conducting small-scale buybacks. Some advocate for reducing expenditures to address the debt burden. Political constraints tilt the risk toward inflation, which harms bondholders' interests. Karen Brettell, Reuters, October 5 - The cost of borrowing for the U.S. government is rising, while it has almost exhausted straightforward ways to control those costs. Long-term Treasury yields are now near their highest levels in two decades, and the causes don't appear to be temporary. Washington is issuing large amounts of government debt to cover a fiscal deficit that shows no signs of shrinking. Inflation is cooling only slowly. Moreover, while the real estate and automotive sectors are struggling, the artificial intelligence investment boom is keeping the economy robust enough to prevent interest rates from falling. As a result, with over $40 trillion in debt, annual interest payments alone amount to around $1 trillion. Washington has options, from relying more on short-term borrowing to, in the most extreme case, having the Federal Reserve cap long-term yields. The more policymakers resort to such measures, the higher the risk of fueling inflation, potentially causing more pain for bondholders in the future. Torsten Slok, Chief Economist at Apollo Global Management, noted that for every $5 the government collects in taxes, $1 goes to service the debt. "That's a very, very high number, and it's only going to grow." U.S. President Donald Trump said in a September 28 interview with Time magazine that debt can be repaid through economic growth or inflation. But if these methods fail, the Treasury has other options ranging from moderate to radical. At present, the Treasury is increasingly relying on issuing short-term bills and conducting small-scale buybacks of old debt to help boost market liquidity. In a worse scenario, the next step would require Fed intervention. One method is large-scale purchases of long-term bonds, akin to 1961's "Operation Twist", another is directly capping long-term yields—a measure not used by the U.S. since World War II. The more aggressive the measures, the more they can suppress rates, but also the greater the risk of spurring inflation. “We are getting to a point where it's clear the government is uncomfortable with current rate levels," said Jeffrey Gundlach, CEO of DoubleLine Capital, at a recent investment event. Operation Twist Historically, the next escalation would likely be a full-scale reactivation of "Operation Twist." Launched in 1961, this strategy involved selling short-term Treasuries and purchasing long-term ones to flatten the yield curve. Implementing a substantial twist would require the Fed's assistance, but the Fed may stand pat unless there is an obvious financial emergency. Slok said that without the Fed's balance sheet, the Treasury has very limited tools for lowering rates. However, Fed Chair Kevin Warsh has criticized holding large amounts of government debt and other securities, arguing that massive bond buying blurs the line between monetary policy and government debt management. He has called for a new agreement between the Treasury and the Fed, under which the Fed Chair and Treasury Secretary would communicate publicly about the Fed's balance sheet and the Treasury’s debt issuance plans. Yield Curve Control If Operation Twist–style purchases don't work, the next move would be explicit yield curve control. In this scenario, the central bank commits to buying an unlimited amount of government debt to keep long-term rates under a set cap. From 1942 until the 1951 Treasury-Fed Accord, the Fed capped long-term Treasury yields at 2.5% to help fund WWII and the postwar recovery. The Bank of Japan implemented a version of this policy from 2016 to 2024. By artificially lowering rates, yield curve control can ease the political pressure of fiscal deficits. But it only works as long as investors aren't worried about being repaid with dollars devalued by inflation. Once that confidence is shaken, bond-buying meant to suppress rates only fuels the inflation it's designed to conceal. Veronique de Rugy, Senior Research Fellow at the Mercatus Center at George Mason University, said that ultimately, the only way to solve the debt problem is by cutting expenditures. “Congress needs to implement fiscal consolidation—in other words, austerity. The Fed cannot do this alone.” Divergent Paths John Higgins, Chief Economic Advisor at Capital Economics, notes that since World War II, the U.S. has only significantly reduced its debt-to-GDP ratio twice, but bondholders' experiences differed substantially each time. After the war, the debt-to-GDP ratio fell from about 106% in 1946 to 23% in 1974, while the 10-year Treasury yield climbed from 2.2% to 7.5%. In the 1990s, the ratio declined from 48% to 32%, and yields fell as well. What made the difference? After WWII, restr
Crypto prices
More


