
IOTA Price Prediction: Is This the Start of a Major Reversal?

IOTA has been a fascinating cryptocurrency in the market, known for its unique Tangle technology, which sets it apart from traditional blockchain-based assets. However, its price performance has been volatile, with massive swings over the past few months. After reaching a high near $0.60 in December 2024, IOTA underwent a steep correction, leaving investors wondering whether it can recover.
The latest price action suggests that IOTA is attempting a strong rebound from key support levels. With a noticeable price surge above $0.24, traders and investors are questioning whether this marks the beginning of a sustained uptrend or just a temporary relief rally. In this analysis, we will examine the critical support and resistance levels, indicators, and potential price targets for IOTA in the coming weeks.
IOTA Price Prediction: What Is the Current Trend in IOTA’s Price Movement?
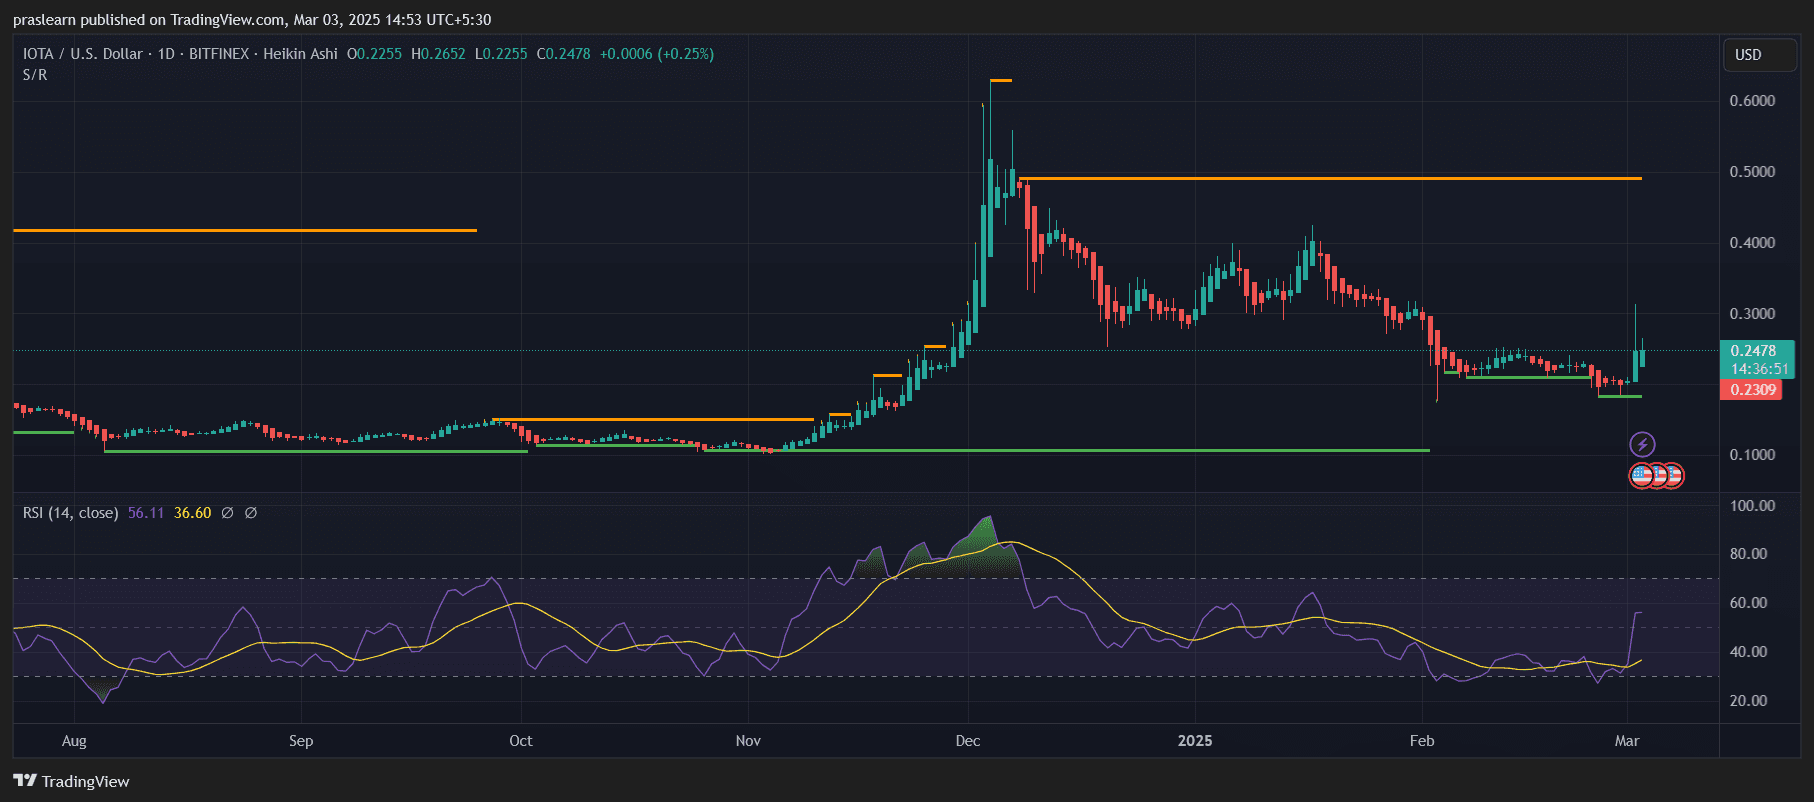 IOTA/USD Daily Chart- TradingView
The IOTA daily chart shows a strong shift in price action after a prolonged downtrend. Recently, the price tested and bounced off a critical support level around $0.12-$0.13, suggesting that buyers are stepping in aggressively. This level had previously acted as a strong base during past corrections, reinforcing its importance.
Since the bounce, IOTA has climbed above $0.24, signaling renewed bullish momentum. A key observation is that the price has broken above previous consolidation ranges, hinting at the possibility of further gains if buyers maintain control.
Has IOTA Formed a Reliable Support Zone?
Yes, the $0.12-$0.13 range has been an essential demand zone for IOTA price , where price reversals have occurred multiple times. This zone serves as a psychological level where buyers find value, making it a crucial reference point for traders.
Currently, a new potential support zone is forming around $0.20-$0.22. If IOTA holds above this area, it will provide a strong foundation for further bullish movement. However, if price action dips below this level, another retest of the lower support levels could be in play.
--> Click here to easily trade IOTA today <--
What Do the Indicators Reveal About IOTA’s Strength?
The Relative Strength Index (RSI) is currently at 56, reflecting increased buying pressure. Previously, RSI was in the oversold zone, but the latest breakout suggests a shift in momentum. If RSI moves above 70, it would indicate overbought conditions, potentially leading to a short-term correction.
Additionally, the Heikin Ashi candlesticks show a clear bullish trend, with multiple consecutive green candles forming. This further confirms the positive momentum in IOTA’s price action . The trend structure suggests that if buyers maintain pressure, IOTA could extend its rally toward the next resistance zones.
Where Is IOTA Headed in the Short Term?
If the current momentum continues, IOTA’s first major resistance zone lies between $0.30 and $0.35. Breaking this level could open the door for a further rise toward $0.40-$0.45 in the coming weeks.
However, if IOTA struggles to sustain above $0.24-$0.25, it might face a pullback toward $0.20-$0.22. If this support holds, it would serve as a potential re-entry zone for traders. But if bears regain control and price falls below $0.20, it could trigger another retest of $0.12-$0.13, which would be a key decision point for the asset.
IOTA Price Prediction: Will IOTA Retest Its Previous Highs?
For IOTA to revisit its $0.50-$0.60 peak, it must overcome multiple resistance levels. A sustained breakout above $0.35 would be the first confirmation of a larger rally. However, macroeconomic conditions and overall market sentiment will play a crucial role in determining whether IOTA can achieve this.
If Bitcoin continues its bullish trajectory, altcoins like IOTA could benefit from increased investor confidence. However, if broader market weakness persists, IOTA might experience sideways consolidation before another breakout attempt.
Key Entry and Exit Points for Traders
Entry Zones (Buy Opportunities):
- $0.20 - $0.22: Ideal re-entry zone if price pulls back and holds this support.
- Breakout Above $0.30: A successful breakout could confirm a bullish continuation toward higher targets.
Exit Zones (Take Profit Levels):
- $0.30 - $0.35: Strong resistance zone, where partial profit-taking could be considered.
- $0.40 - $0.45: A higher resistance area that could act as a near-term target.
- $0.50 - $0.60: A major resistance zone, where strong selling pressure could emerge.
Is Now a Good Time to Buy IOTA?
The recent breakout from support and bullish RSI movement suggest that IOTA could be entering a new uptrend. However, traders should watch key resistance levels before expecting a full recovery to previous highs.
For long-term investors, accumulating near $0.20-$0.22 could be a strong opportunity, given that IOTA has historically rebounded from these levels. On the other hand, short-term traders should focus on breakouts above $0.30 for confirmation of further bullish momentum.
--> Click here to easily trade IOTA today <--
Disclaimer: The content of this article solely reflects the author's opinion and does not represent the platform in any capacity. This article is not intended to serve as a reference for making investment decisions.
You may also like
NEAR Loses Critical $5 Level After Brutal $20M Long Squeeze: More Pain Ahead?
If US Treasury yields continue to rise, what will Washington do next?
The Treasury has maintained liquidity by increasing the issuance of short-term Treasury bills and conducting small-scale buybacks. Some advocate for reducing expenditures to address the debt burden. Political constraints tilt the risk toward inflation, which harms bondholders' interests. Karen Brettell, Reuters, October 5 - The cost of borrowing for the U.S. government is rising, while it has almost exhausted straightforward ways to control those costs. Long-term Treasury yields are now near their highest levels in two decades, and the causes don't appear to be temporary. Washington is issuing large amounts of government debt to cover a fiscal deficit that shows no signs of shrinking. Inflation is cooling only slowly. Moreover, while the real estate and automotive sectors are struggling, the artificial intelligence investment boom is keeping the economy robust enough to prevent interest rates from falling. As a result, with over $40 trillion in debt, annual interest payments alone amount to around $1 trillion. Washington has options, from relying more on short-term borrowing to, in the most extreme case, having the Federal Reserve cap long-term yields. The more policymakers resort to such measures, the higher the risk of fueling inflation, potentially causing more pain for bondholders in the future. Torsten Slok, Chief Economist at Apollo Global Management, noted that for every $5 the government collects in taxes, $1 goes to service the debt. "That's a very, very high number, and it's only going to grow." U.S. President Donald Trump said in a September 28 interview with Time magazine that debt can be repaid through economic growth or inflation. But if these methods fail, the Treasury has other options ranging from moderate to radical. At present, the Treasury is increasingly relying on issuing short-term bills and conducting small-scale buybacks of old debt to help boost market liquidity. In a worse scenario, the next step would require Fed intervention. One method is large-scale purchases of long-term bonds, akin to 1961's "Operation Twist", another is directly capping long-term yields—a measure not used by the U.S. since World War II. The more aggressive the measures, the more they can suppress rates, but also the greater the risk of spurring inflation. “We are getting to a point where it's clear the government is uncomfortable with current rate levels," said Jeffrey Gundlach, CEO of DoubleLine Capital, at a recent investment event. Operation Twist Historically, the next escalation would likely be a full-scale reactivation of "Operation Twist." Launched in 1961, this strategy involved selling short-term Treasuries and purchasing long-term ones to flatten the yield curve. Implementing a substantial twist would require the Fed's assistance, but the Fed may stand pat unless there is an obvious financial emergency. Slok said that without the Fed's balance sheet, the Treasury has very limited tools for lowering rates. However, Fed Chair Kevin Warsh has criticized holding large amounts of government debt and other securities, arguing that massive bond buying blurs the line between monetary policy and government debt management. He has called for a new agreement between the Treasury and the Fed, under which the Fed Chair and Treasury Secretary would communicate publicly about the Fed's balance sheet and the Treasury’s debt issuance plans. Yield Curve Control If Operation Twist–style purchases don't work, the next move would be explicit yield curve control. In this scenario, the central bank commits to buying an unlimited amount of government debt to keep long-term rates under a set cap. From 1942 until the 1951 Treasury-Fed Accord, the Fed capped long-term Treasury yields at 2.5% to help fund WWII and the postwar recovery. The Bank of Japan implemented a version of this policy from 2016 to 2024. By artificially lowering rates, yield curve control can ease the political pressure of fiscal deficits. But it only works as long as investors aren't worried about being repaid with dollars devalued by inflation. Once that confidence is shaken, bond-buying meant to suppress rates only fuels the inflation it's designed to conceal. Veronique de Rugy, Senior Research Fellow at the Mercatus Center at George Mason University, said that ultimately, the only way to solve the debt problem is by cutting expenditures. “Congress needs to implement fiscal consolidation—in other words, austerity. The Fed cannot do this alone.” Divergent Paths John Higgins, Chief Economic Advisor at Capital Economics, notes that since World War II, the U.S. has only significantly reduced its debt-to-GDP ratio twice, but bondholders' experiences differed substantially each time. After the war, the debt-to-GDP ratio fell from about 106% in 1946 to 23% in 1974, while the 10-year Treasury yield climbed from 2.2% to 7.5%. In the 1990s, the ratio declined from 48% to 32%, and yields fell as well. What made the difference? After WWII, restr
Crypto prices
More


