
Sonic (S) Surges to Multi-Day High, Bulls Eye Further Gains

Sonic (S) has seen a 15% surge in the last 24 hours, with its price reaching $0.51. The token eyes further gains as it moves toward key resistance levels.
Sonic’s S has emerged as the market’s top gainer in the past 24 hours. Its price is up 15% in the past day as bullish momentum strengthens across the crypto market.
With a broader market recovery underway, investor sentiment toward the altcoin is turning increasingly positive, hinting at an extended uptrend.
Sonic’s Rally Gains Strength
Currently trading at a five-day high of $0.51, S is attempting to break above its Ichimoku Cloud. The token has climbed above the Cloud’s Leading Span A (green) and is now rallying toward the Leading Span B (red).
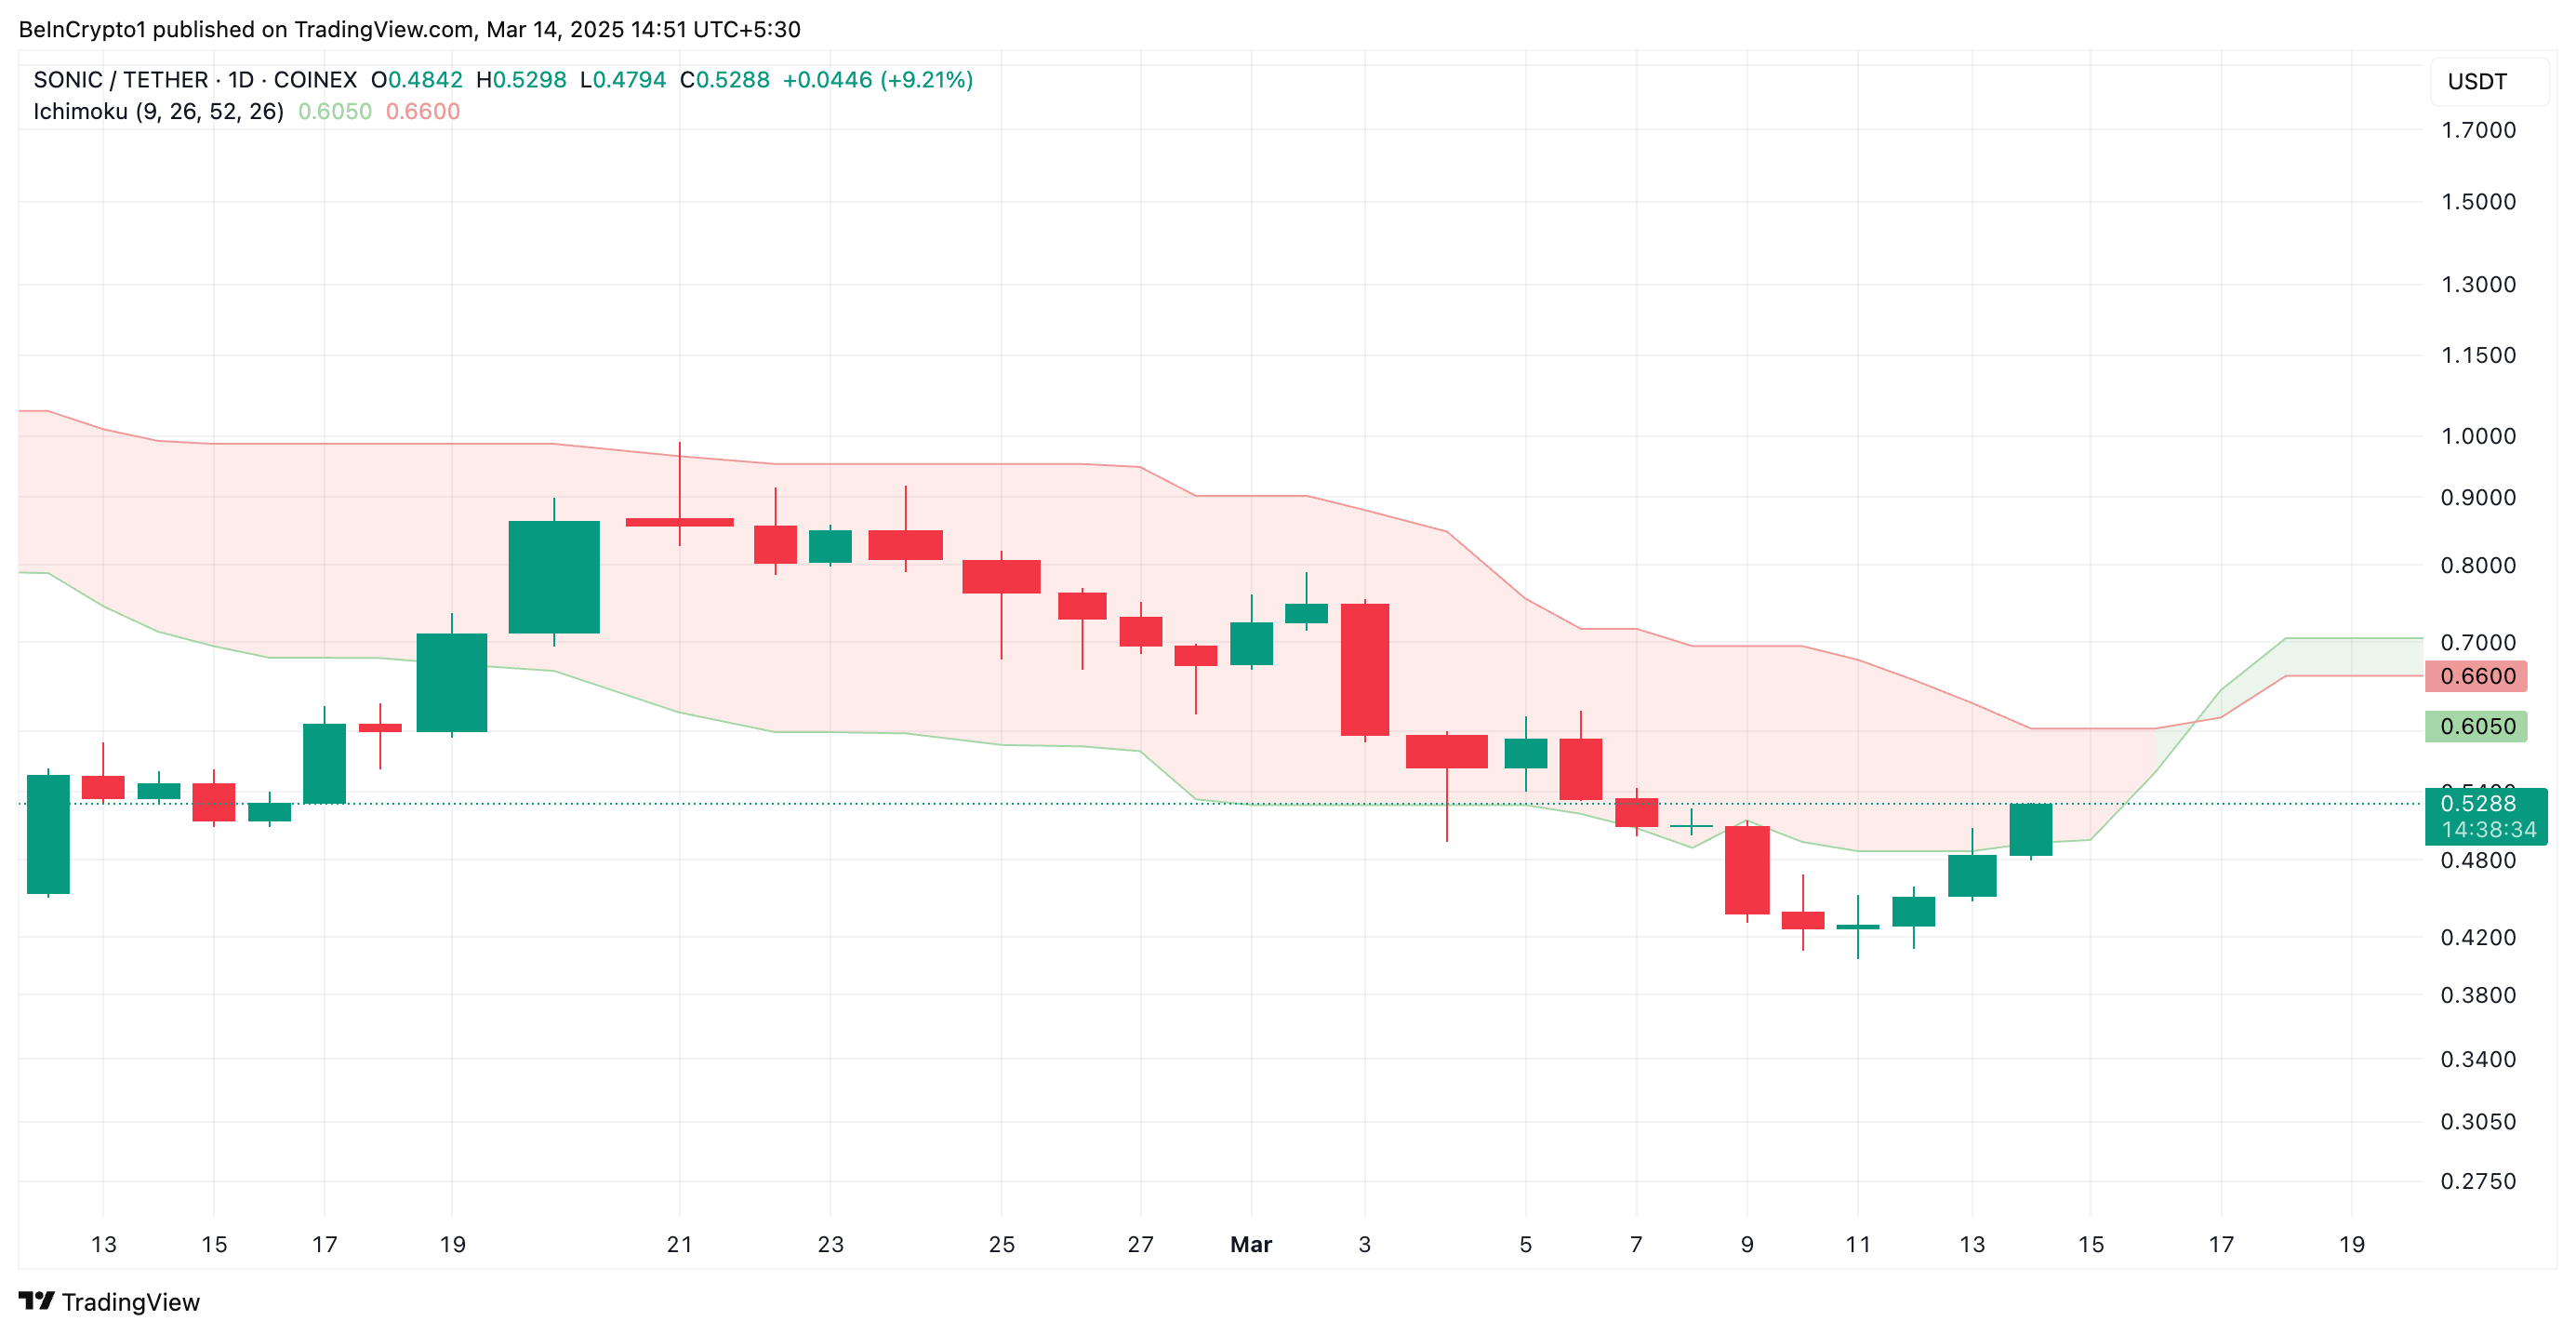 S Ichimoku Cloud. Source:
TradingView
S Ichimoku Cloud. Source:
TradingView
The Ichimoku Cloud tracks the momentum of an asset’s market trends and identifies potential support/resistance levels. When the price crosses the Leading Span A of this indicator, it signals a shift toward bullish momentum as demand rises.
With S continuing its rally toward the Leading Span B, an attempt to fully break out of the cloud would reinforce the bullish trend. A successful move above the red line would confirm the strong uptrend and indicate that S has cleared significant resistance.
Furthermore, S’ rising Relative Strength Index (RSI) confirms the positive trend, indicating strengthening momentum. At press time, this indicator, which measures an asset’s oversold and overbought market conditions, is climbing toward the 50-neutral line.
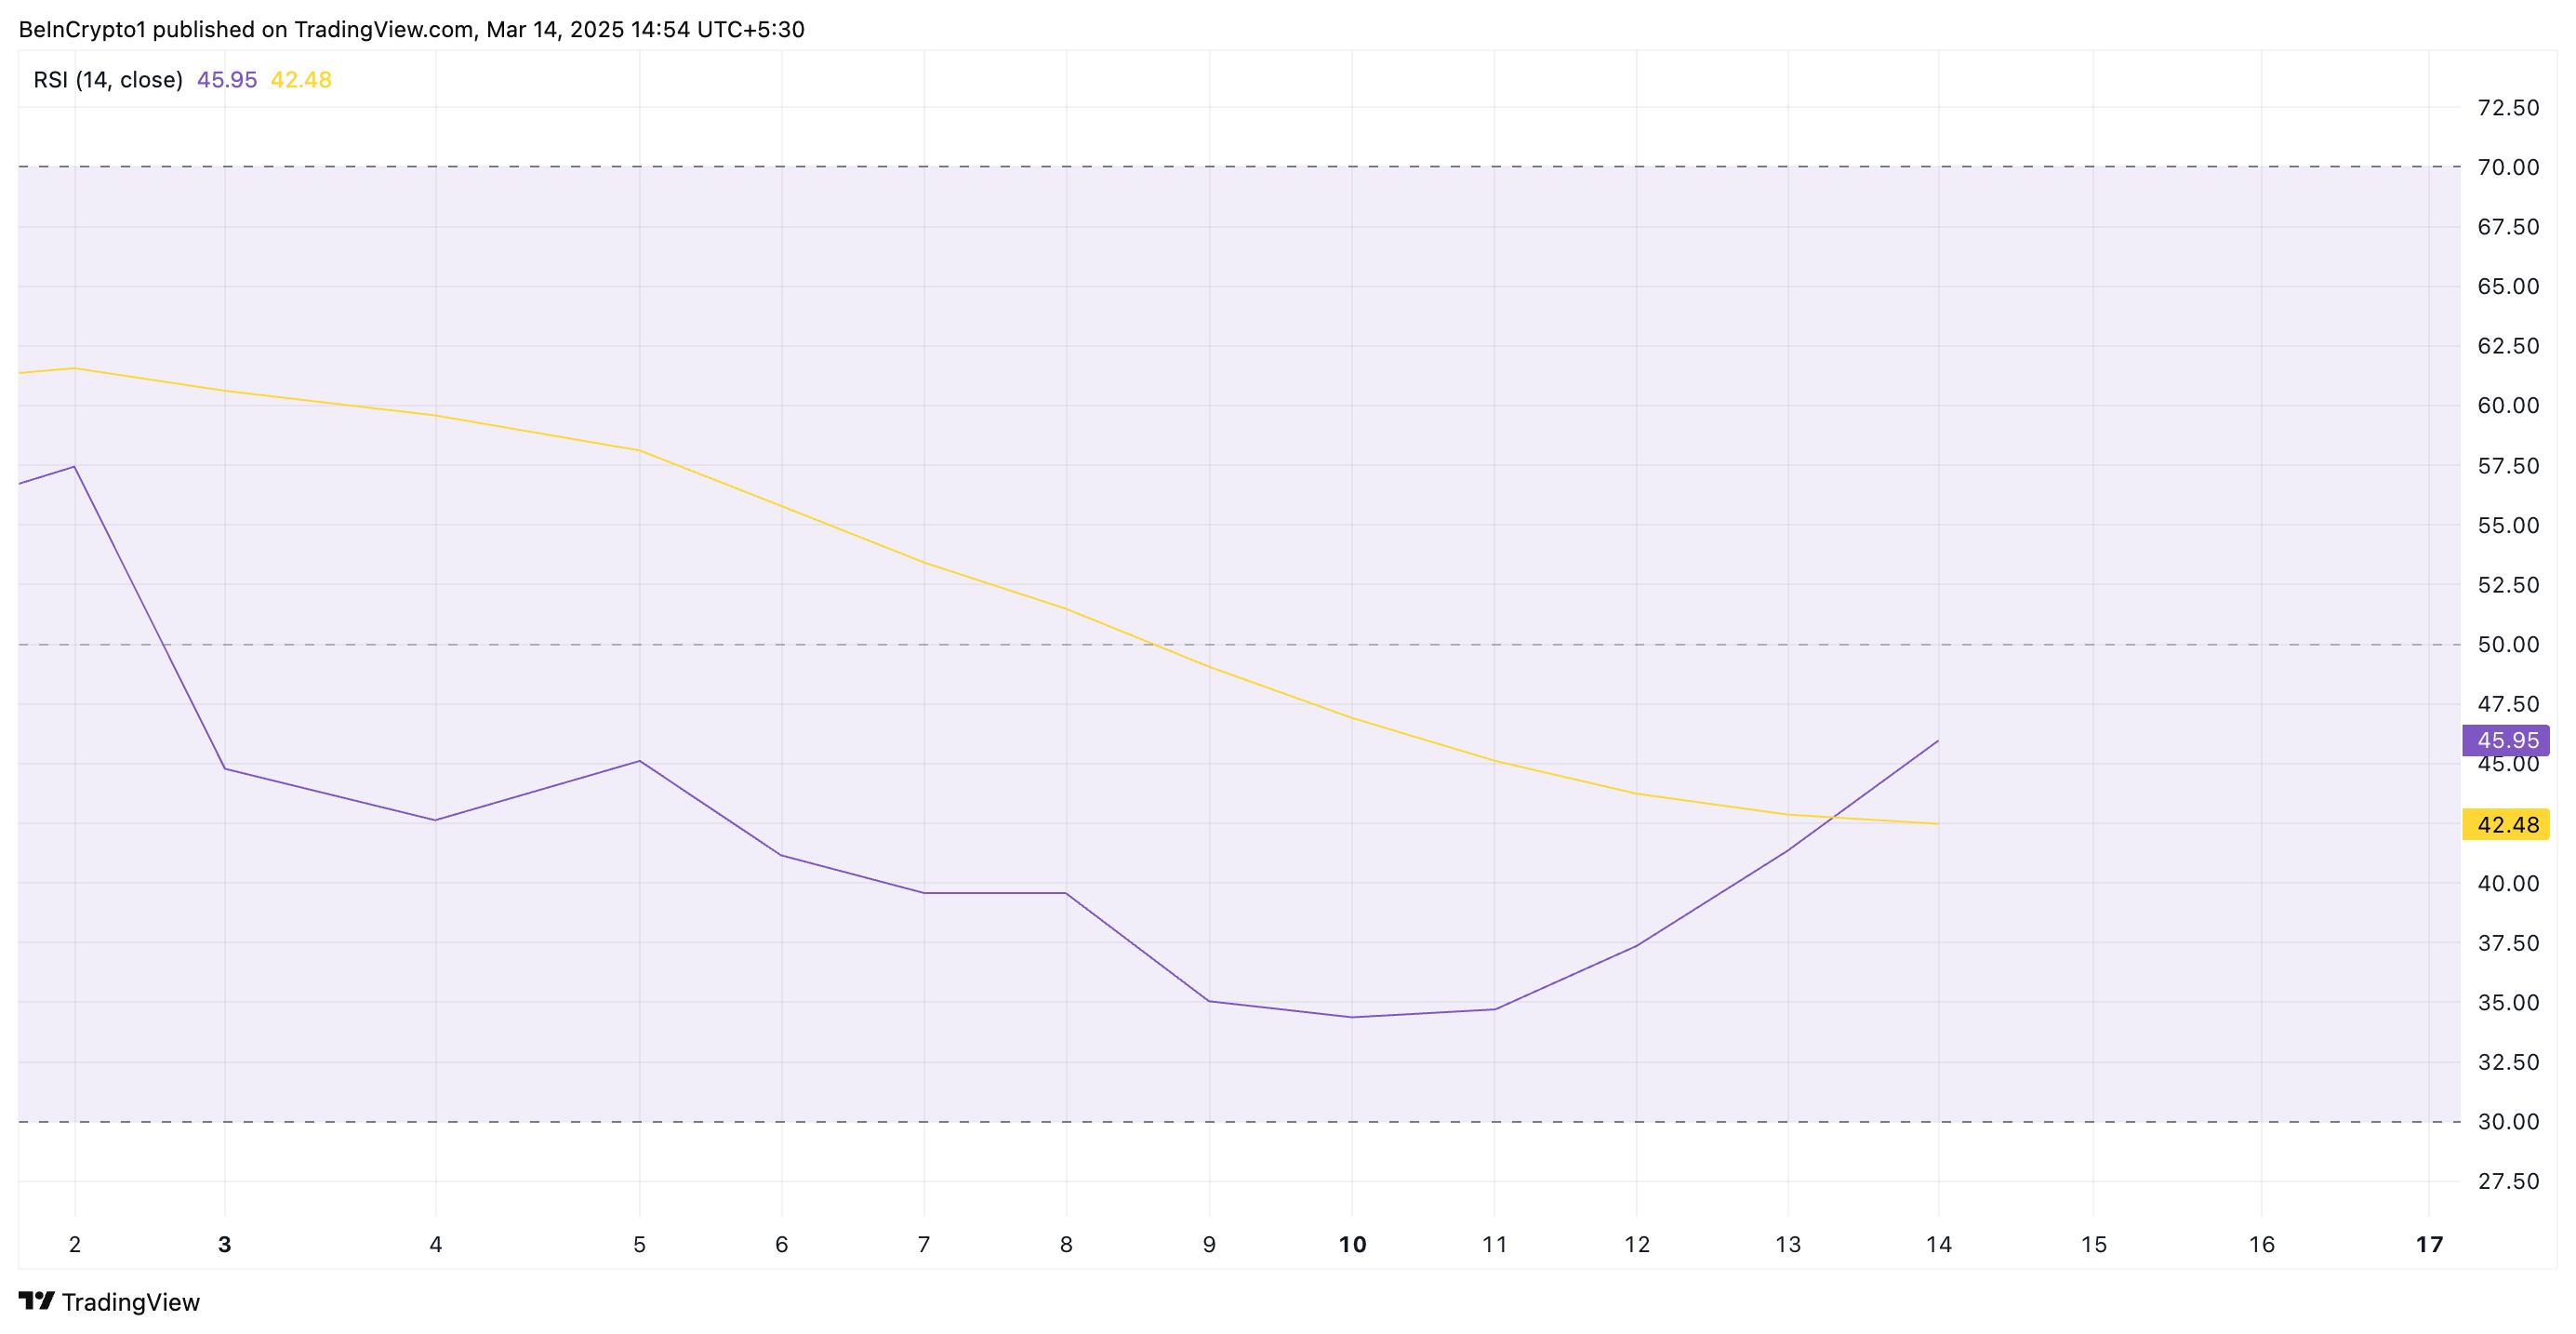 S RSI. Source:
TradingView
S RSI. Source:
TradingView
This RSI reading signals growing bullish sentiment among S holders as buying pressure increases. This move suggests a bullish reversal in the token’s price action.
S at a Crossroads: Rally Above $0.66 or Dip Below $0.33?
A sustained demand for S could push its price above the resistance at $0.59. If the token manages to flip this price level into a support floor, it could attempt to rally beyond the Leading Span B, which forms dynamic resistance above S’ price at $0.66.
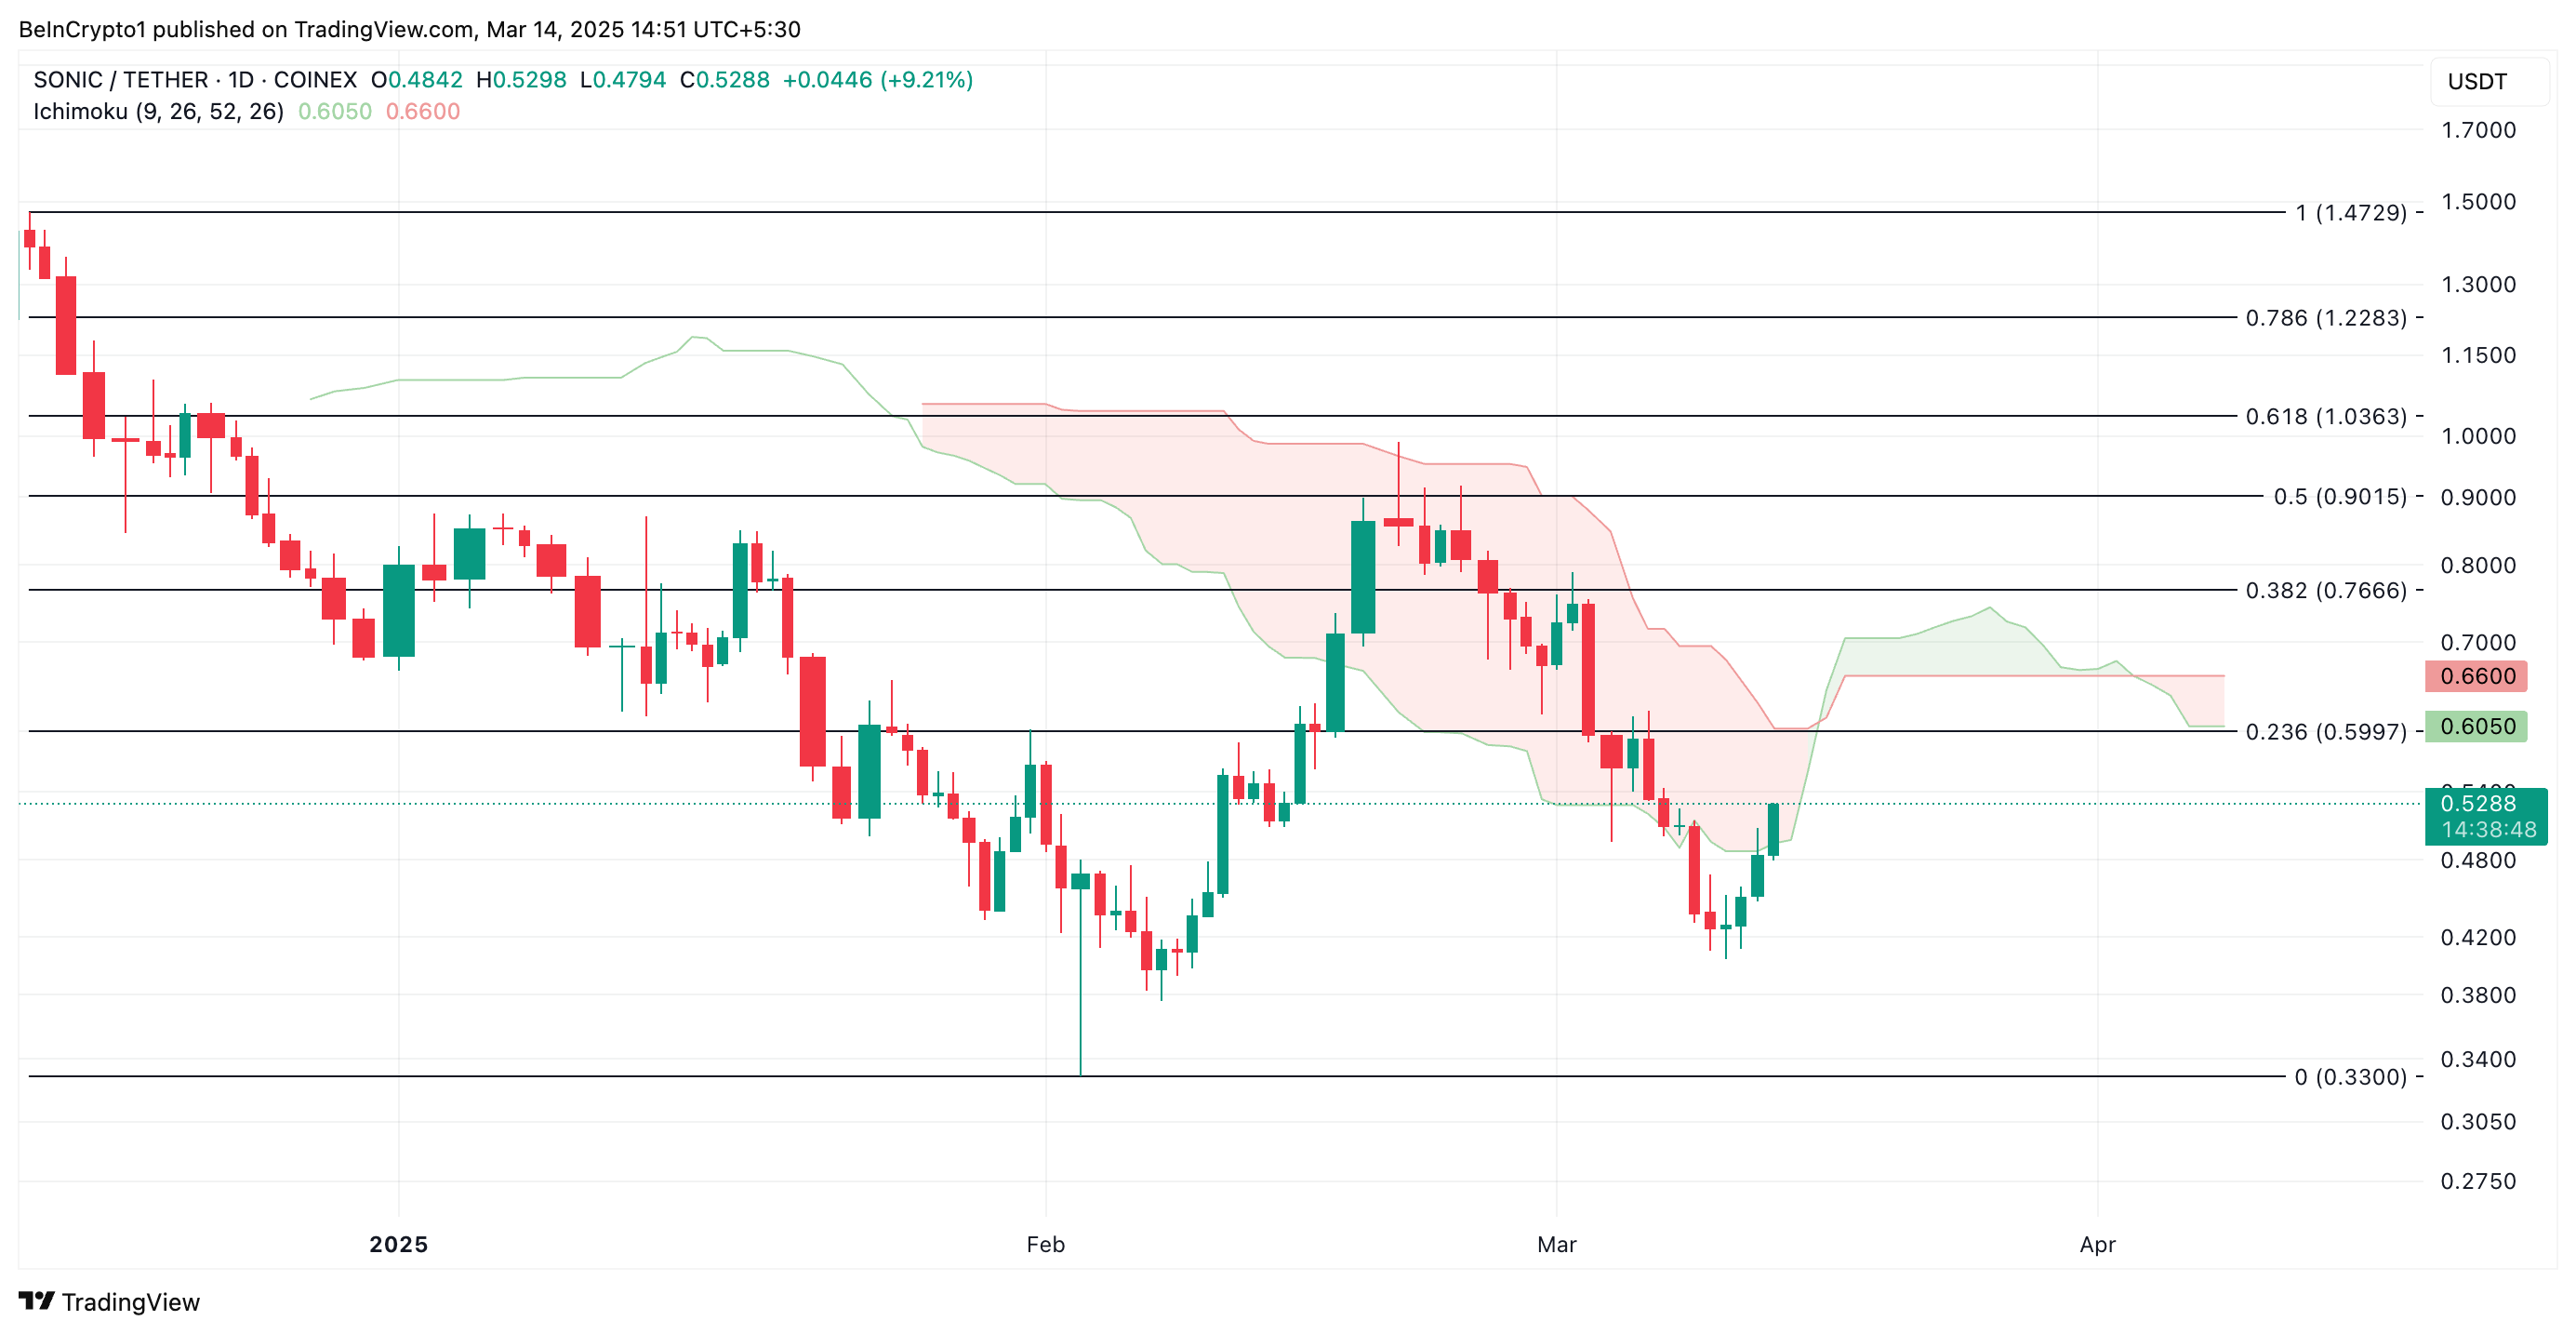 S Price Analysis. Source:
TradingView
S Price Analysis. Source:
TradingView
However, if selloffs resume, this bullish projection would be invalidated. In that scenario, S’ price could fall below the Cloud to trade at $0.33.
Disclaimer: The content of this article solely reflects the author's opinion and does not represent the platform in any capacity. This article is not intended to serve as a reference for making investment decisions.
You may also like
After a two-month drop of 11%, Goldman Sachs reverses stance and goes long: Is a "golden dip" coming for the semiconductor sector?
Goldman Sachs has turned positive on the Philadelphia Semiconductor Index after an 11% decline over the past two months, shifting its third-quarter outlook. The bank is optimistic about equipment, storage, and analog sectors, issuing "Buy" ratings for 12 stocks including AMD, while remaining bearish on Arm and Texas Instruments.

Forex Today: US Dollar clings to bullish stance ahead of mid-tier data releases
TSMC (TSM.US) receives bullish rating from Goldman Sachs ahead of earnings: Strong AI demand supports growth momentum through 2027, with nearly 40% upside potential for stock price
Goldman Sachs stated in a recent research report that TSMC's strong performance growth momentum is expected to continue until 2027, and its capital expenditure will gradually increase to support long-term demand.
Ripple president Monica Long unveils XRP credit pilot at Seoul event
Crypto prices
More


