Bitget App
Trade smarter
Buy cryptoMarketsTradeFuturesStocksEarnInstitutionAI & More
VET and XTZ Approaches Falling Wedge Resistance – Could Breakout Spark a Recovery?

VET and XTZ Approaches Falling Wedge Resistance – Could Breakout Spark a Recovery?

CoinsProbeCoinsProbe2025/03/16 18:22
By:Nilesh Hembade

Date: Sun, March 16, 2025 | 04:40 AM GMT

The cryptocurrency market is showing signs of stabilization as Bitcoin (BTC) has bounced back from its recent dip near $76,000 and is now trading around $84,000. This positive shift is giving  altcoins a much-needed boost— to tokens like Vechain (VET) and Tezos (XTZ), both of which have suffered heavily over the last 90 days.
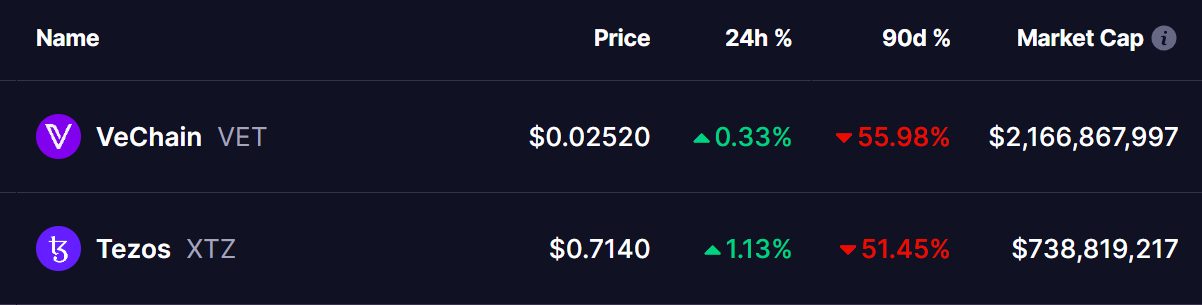
VET and XTZ Approaches Falling Wedge Resistance – Could Breakout Spark a Recovery? image 0 Source: Coinmarketcap

However, as the market stabilizes, both tokens are approaching key resistance levels within their respective falling wedge patterns. A potential breakout could signal the beginning of a strong recovery for both assets.

VeChain (VET) Analysis

VET’s daily chart highlights a clear falling wedge pattern that began after its rejection from the December 3 high of $0.080. Since then, the token has dropped more than 68%, hitting a low of $0.021 on March 11.

Vechain (VET) Daily Chart/Coinsprobe (Source: Tradingview)

But momentum seems to be shifting. VET has climbed back to $0.025, now pressing against the upper boundary of the wedge. A breakout above this resistance—ideally confirmed with a successful retest—could open the door for a move toward $0.036, which aligns with the 50-day moving average (MA).

If the rally gains strength, VET could aim even higher—toward the $0.048 zone, near the 100-day MA. That would mark a potential 92% gain from current levels.

Tezos (XTZ) Analysis

XTZ has followed a similar trajectory. After peaking at $1.90 in early December, the token dropped over 68%, bottoming out at $0.61 on March 11.

Tezos (XTZ) Daily Chart/Coinsprobe (Source: Tradingview)

Currently trading around $0.7145, XTZ is edging closer to breaking out of its own falling wedge pattern. A successful breakout and retest could push the price toward the $0.92 resistance level, in line with its 50-day MA.

If bullish momentum continues, the next target could be $1.13, near the 200-day MA—representing a potential 57% rally from current prices.

What’s Next for VET and XTZ?

Both tokens are now at crucial technical junctures. Falling wedge patterns are often early indicators of a reversal, but confirmation with volume and follow-through is key. Traders will be watching closely for decisive breakouts.

While technicals look promising, broader market sentiment, Ethereum’s next big move, and macroeconomic factors will still play a significant role in shaping what comes next.

Disclaimer: This article is for informational purposes only and does not constitute financial advice. Always do your own research before making any investment decisions.


2
0

Disclaimer: The content of this article solely reflects the author's opinion and does not represent the platform in any capacity. This article is not intended to serve as a reference for making investment decisions.

Understand the market, then trade.
Bitget offers one-stop trading for cryptocurrencies, stocks, and gold.
Trade now!

You may also like

After Toshiba reported news of HDD production expansion, Morgan Stanley turned more bullish rather than bearish.

Morgan Stanley’s research indicates that the market has seriously overestimated Toshiba’s expansion scale — the doubling of capacity at its Philippines plant over two years translates to an annualized growth rate of about 30%, which is similar to the overall industry supply growth rate and far lower than demand growth. More importantly, channel checks show that Seagate and Western Digital have no intention of following suit with capacity expansion, and there are no signs of loosening in industry pricing.

华尔街见闻•2026/10/06 08:42

Energy & Utilities Roundup: Market Talk

The latest Market Talks covering Energy and Utilities. Published exclusively on Dow Jones Newswires at 4:20 ET, 12:20 ET and 16:50 ET. 0637 GMT - SK Innovation is likely to benefit from higher lubricant base oil prices, LS Securities analyst K.H. Chung says. The South Korean refiner is a global leader in premium lubricant base oils, producing about 80,000 barrels of Group III base oils a day, Chung writes in a note. She expects the supply shortage of lubricant base oils to persist for more than a year. Tight supply of kerosene and diesel and wider refining margins could also continue to boost the company's earnings, she adds. LS Securities upgrades the stock to buy from hold and raises its target price to 187,000 won from 126,000 won. Shares end 2.6% higher at 158,000 won. (kwanwoo.jun@wsj.com) 0113 GMT - YTL Power International could see upside from its expanding data-center and AI infrastructure, as well as renewed power-generation opportunities, says Hong Leong IB analyst Daniel Wong in a note. Its Kulai and Sedenak West hubs offer 2.4GW of potential data-center capacity, while its AI-GPU capacity could scale to 100MW or more and support a new services business. The procurement of seven gas turbines totaling 5.25GW also positions YTL for power-generation growth and supports its expanding data-center pipeline, he reckons. Higher water tariffs and planned treatment plants at its unit Ranhill Utilities should support earnings as Johor's water demand rises, he adds. Hong Leong raises its target price to 8.08 ringgit from 7.58 ringgit and keeps a buy rating. Shares are 1.4% higher at 5.62 ringgit. (yingxian.wong@wsj.com) The price fetched by Amplitude Energy for its natural gas in 1Q should improve on the prior three months, supporting growth in revenue. That's the view of Bell Potter analyst Stuart Howe, who points to higher gas volumes in the quarter. Also, spot natural gas prices recovered to a quarterly average of A$9.77 per gigajoule, from A$8.42 per gigajoule in 4Q of FY26. Amplitude is due to report its 1Q p

Dow Jones•2026/10/06 08:20