
Pi Network’s PI Faces Strong Selling Pressure as Price Drops 14%

PI's price continues to fall, driven by increasing selling pressure and a bearish descending pattern. With the Super Trend Indicator flashing a sell signal, further declines are possible unless bullish momentum resurges.
PI’s bullish momentum appears to be fading, and the altcoin has continued its downward trajectory since the start of March.
Over the past 24 hours, the altcoin’s price has plunged by 14%, reinforcing this bearish trend and signaling increased selling pressure in the market.
Pi Network Bears Tighten Grip
Since the beginning of March, PI has been in decline. The token has traded within a descending parallel channel, a pattern that typically indicates sustained downward movement.
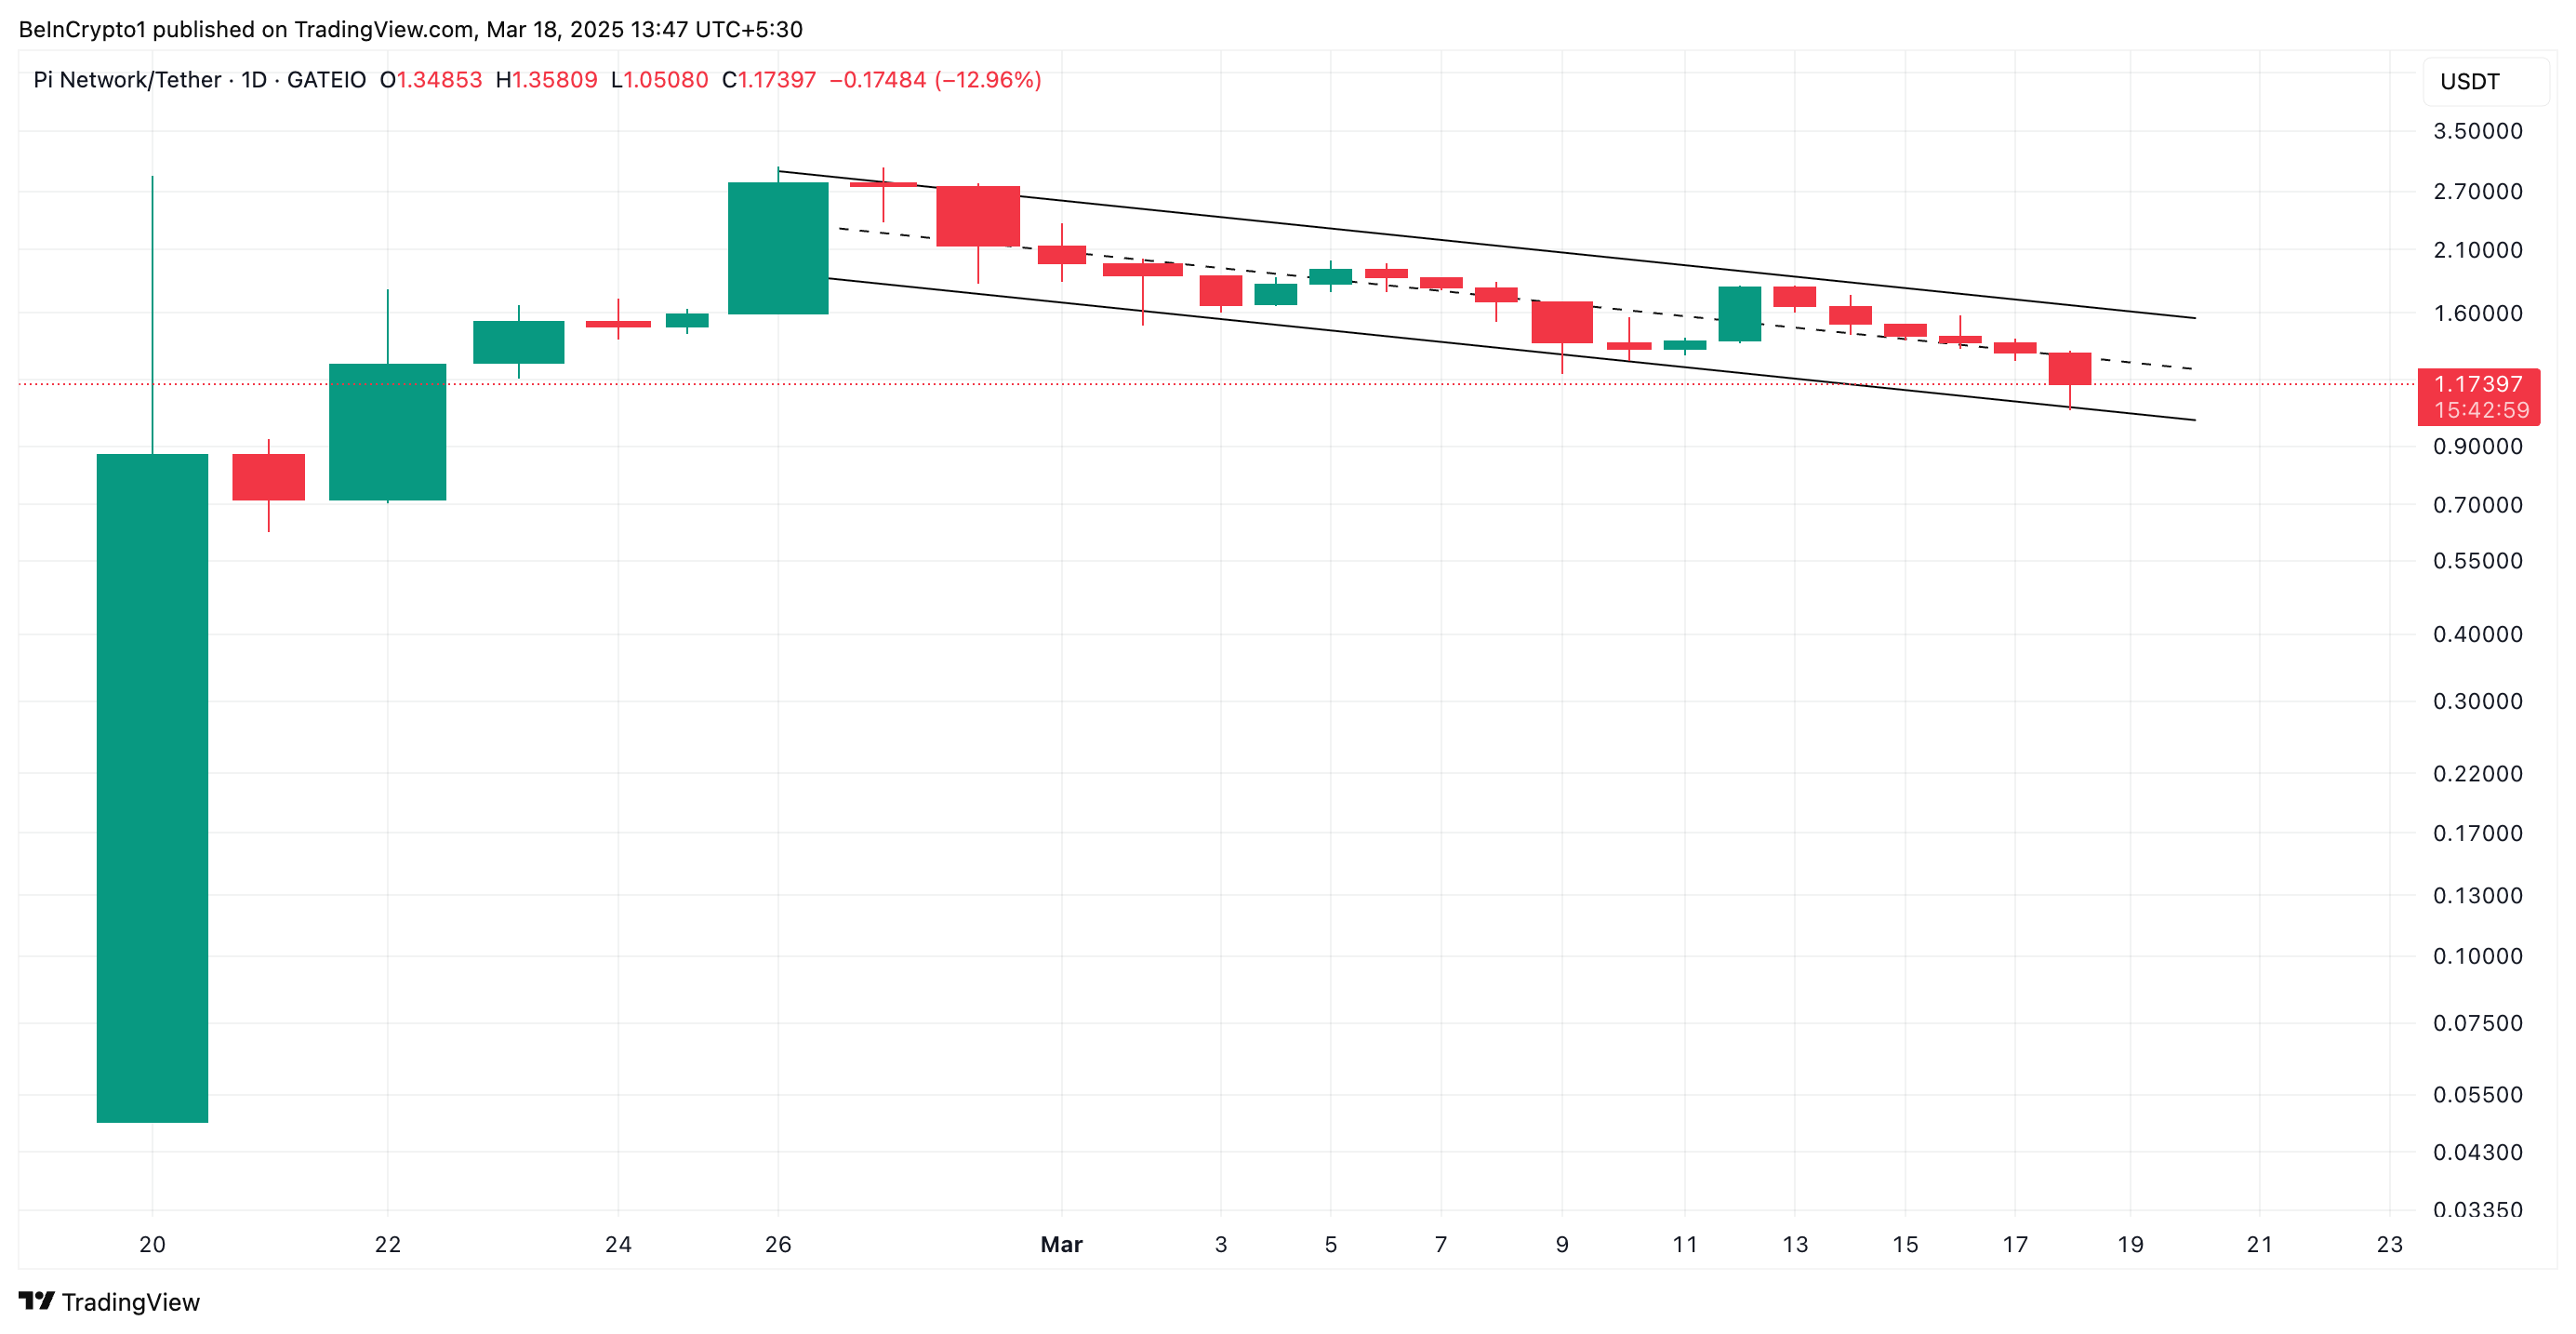 PI Descending Parallel Channel. Source:
TradingView
PI Descending Parallel Channel. Source:
TradingView
This bearish pattern is formed when an asset’s price moves within two downward-sloping parallel trendlines, creating a pattern of lower highs and lower lows.
The structure indicates a sustained bearish trend in the PI market, where sellers consistently push prices lower while buyers fail to establish higher price levels.
Moreover, the Super Trend Indicator has flashed a sell signal, further confirming PI’s bearish outlook. This momentum indicator currently forms dynamic resistance above the token’s price at $2.23.
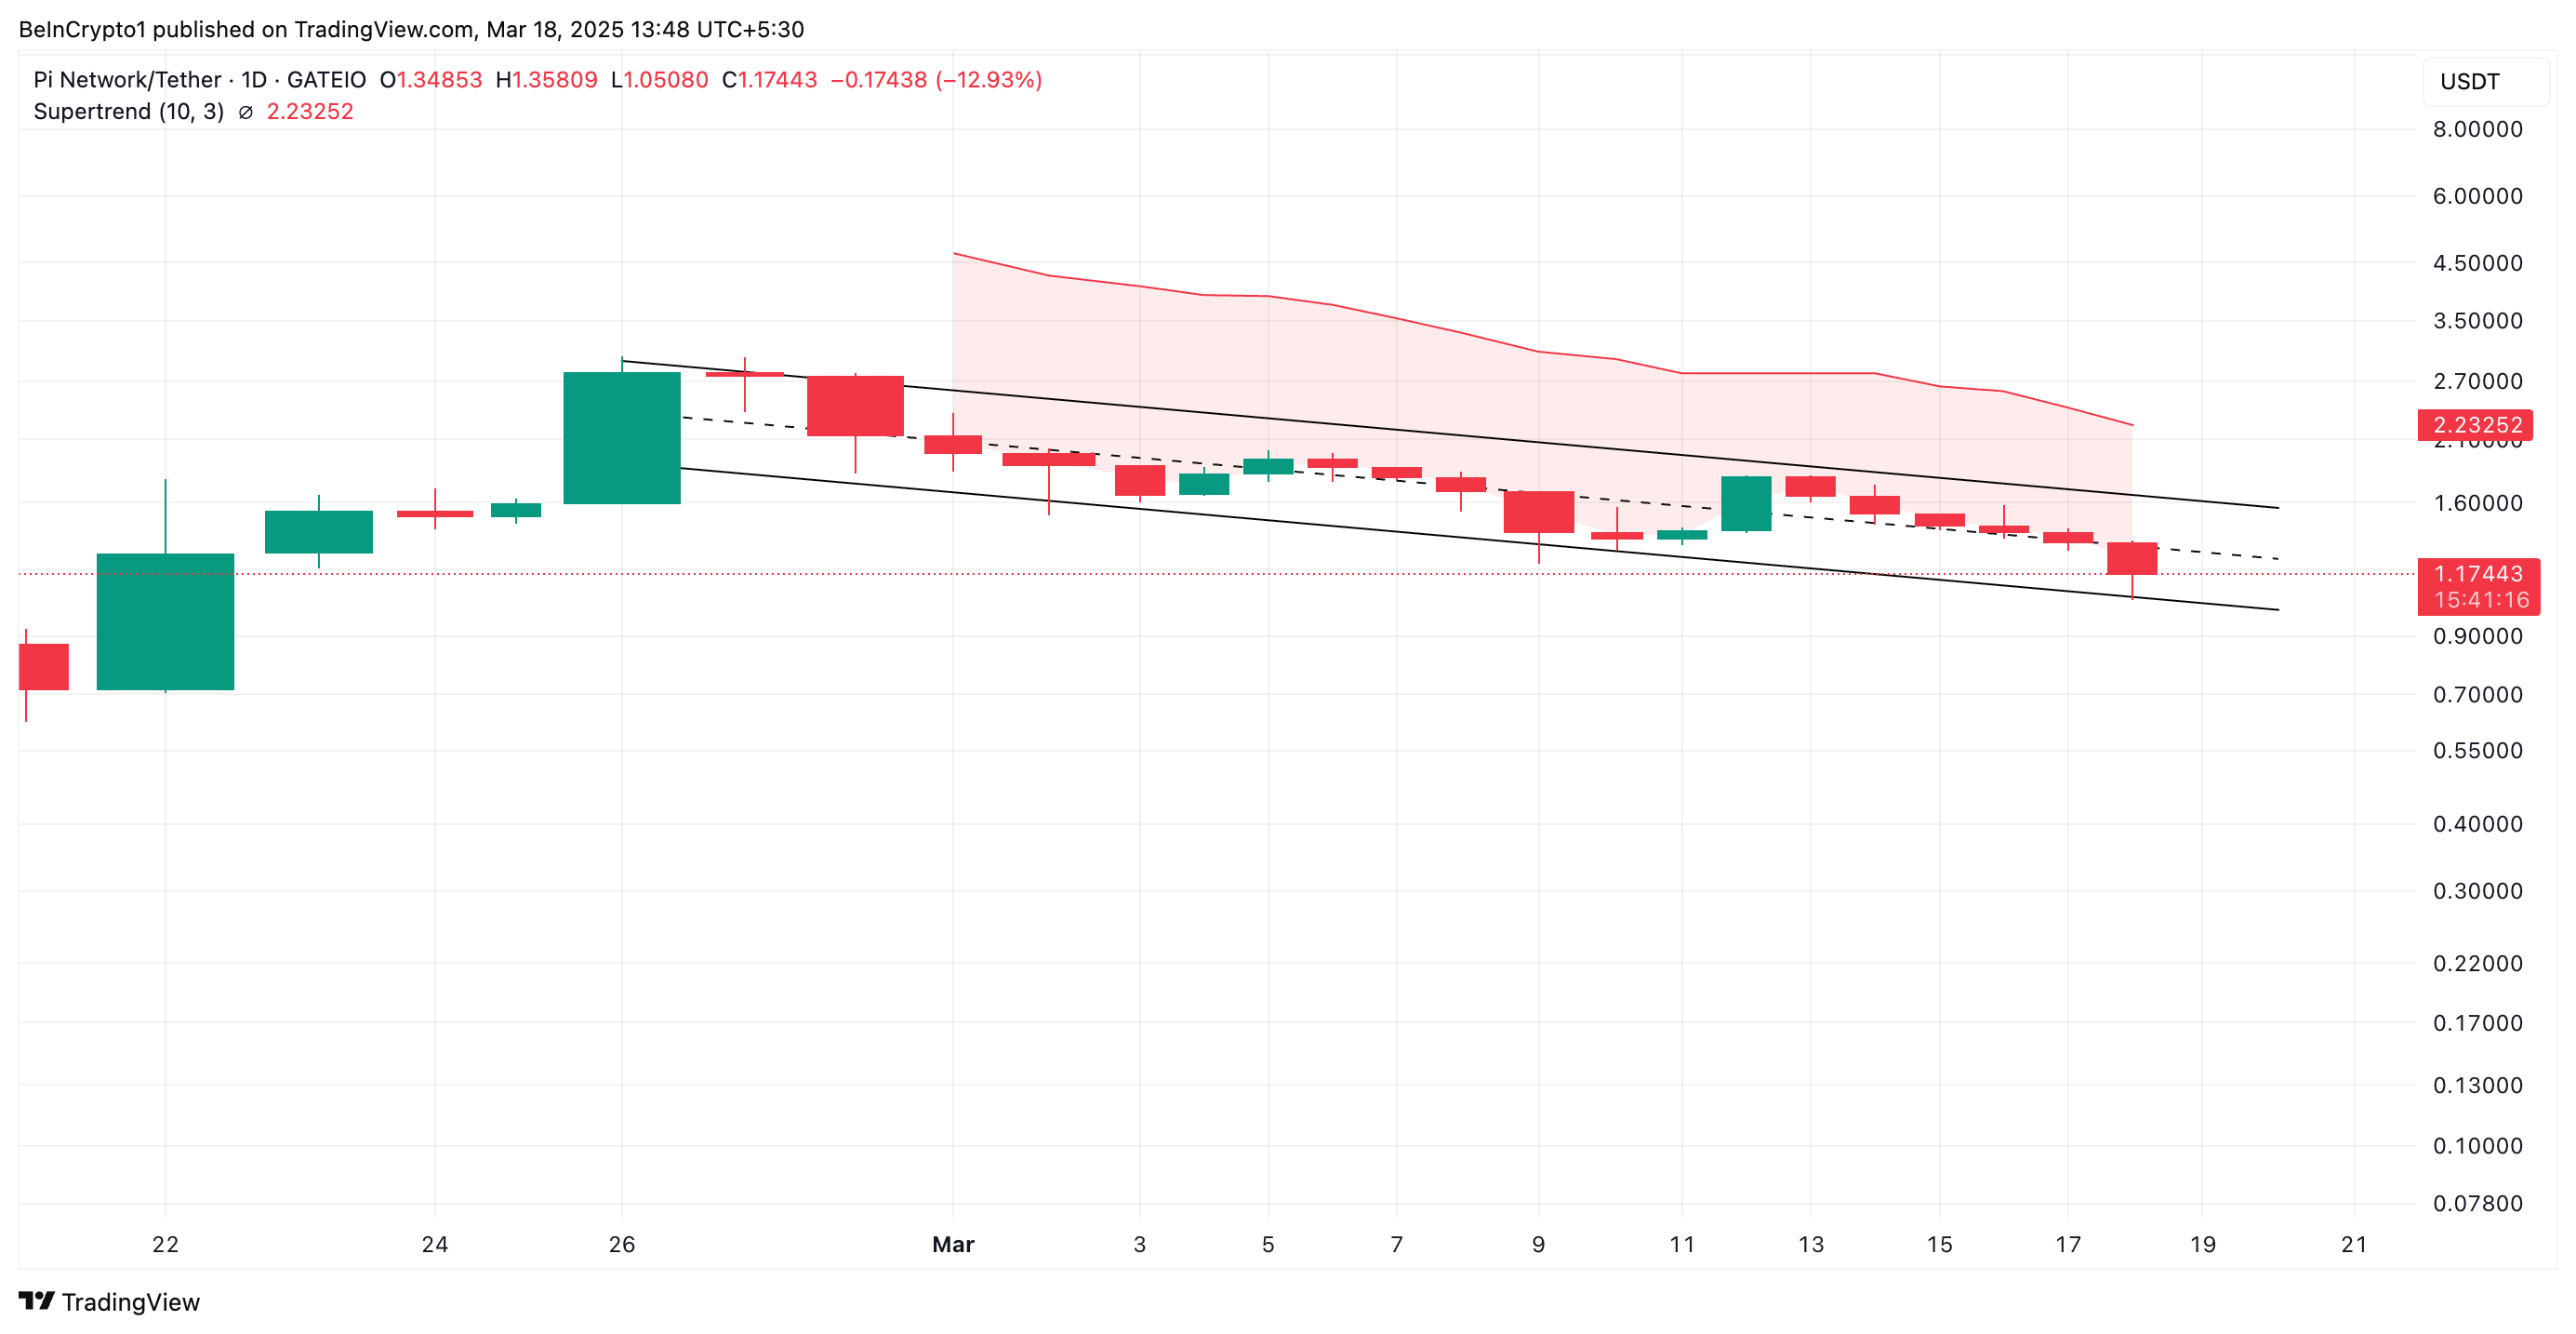 PI Super Trend Indicator. Source:
TradingView
PI Super Trend Indicator. Source:
TradingView
This indicator tracks the direction and strength of an asset’s price trend. It is displayed as a line on the price chart, changing color to signify the trend: green for an uptrend and red for a downtrend.
When an asset’s price trades below its Super Trend indicator, it is a bearish trend, signaling a decline in buying pressure. Traders interpret this as a sell signal or a warning to exit long positions and take short ones.
PI Downtrend Deepens: Can Bulls Prevent a Drop to $0.87?
PI risks noting further declines if selling pressure gains more momentum. In this scenario, the altcoin could fall toward $1.05 in an attempt to break below its descending parallel channel.
This would signal an acceleration of the current downtrend, indicating that selling pressure has intensified. It would mean that PI bears have taken full control, increasing the likelihood of further declines as support levels fail to hold.
 PI Price Analysis. Source:
TradingView
PI Price Analysis. Source:
TradingView
However, if accumulation resumes and bullish pressure spikes, PI could reverse its current trend and climb to $1.34.
Disclaimer: The content of this article solely reflects the author's opinion and does not represent the platform in any capacity. This article is not intended to serve as a reference for making investment decisions.
You may also like
Money market fund inflows plummet to 158 billion—Is short-term US Treasury liquidity flashing a warning sign?
Money market fund inflows have sharply dropped to $158 billion in the first three quarters of this year, driving Treasury yields higher. Increased volatility at the short end has raised market concerns about tightening short-term financing.
TAO crypto price consolidates – Why $318 is Bittensor’s next big test
Tokenization Becomes a Key Focus for the U.K. Financial Sector

Solana brings instant trade settlement down from 1–2 days to seconds
Crypto prices
More


