Bitget App
Trade smarter
Buy cryptoMarketsTradeFuturesStocksEarnInstitutionAI & More
Bitcoin price volatility ramps up around FOMC days — Will this time be different?

Bitcoin price volatility ramps up around FOMC days — Will this time be different?

CointelegraphCointelegraph2025/03/19 07:30
By:Marie Poteriaieva

Bitcoin traders tend to cut risk leading into FOMC meetings, but key price metrics are showing a divergence. Will BTC rally when the Fed minutes are released?

At the start of the week, Bitcoin ( BTC ) price succumbed to pressure from sellers, declining from $84,500 on March 17, to $81,300 at the time of writing. This downward movement was most likely a sell-off related to the Federal Open Market Committee’s (FOMC) two-day meeting, which takes place on March 18-19.

Federal Open Market Committee (FOMC) meetings tend to act as market resets. Each time the FOMC meets to deliberate on US monetary policy, crypto markets brace for impact.

Historically, traders de-risk and reduce leverage ahead of the announcement, and after the meeting and press conference from Federal Reserve Chair Jerome Powell the markets can be equally reactive.

The press release of the current FOMC meeting scheduled for Wednesday, March 19, at 2:30 pm ET, and it could trigger major movements in the Bitcoin market. Analyzing market behavior leading to its release could offer clues about Bitcoin’s next move. 

To traders, FOMC means volatility

Traders are closely monitoring the FOMC minutes for any shifts in the Fed’s stance on inflation and interest rates. 

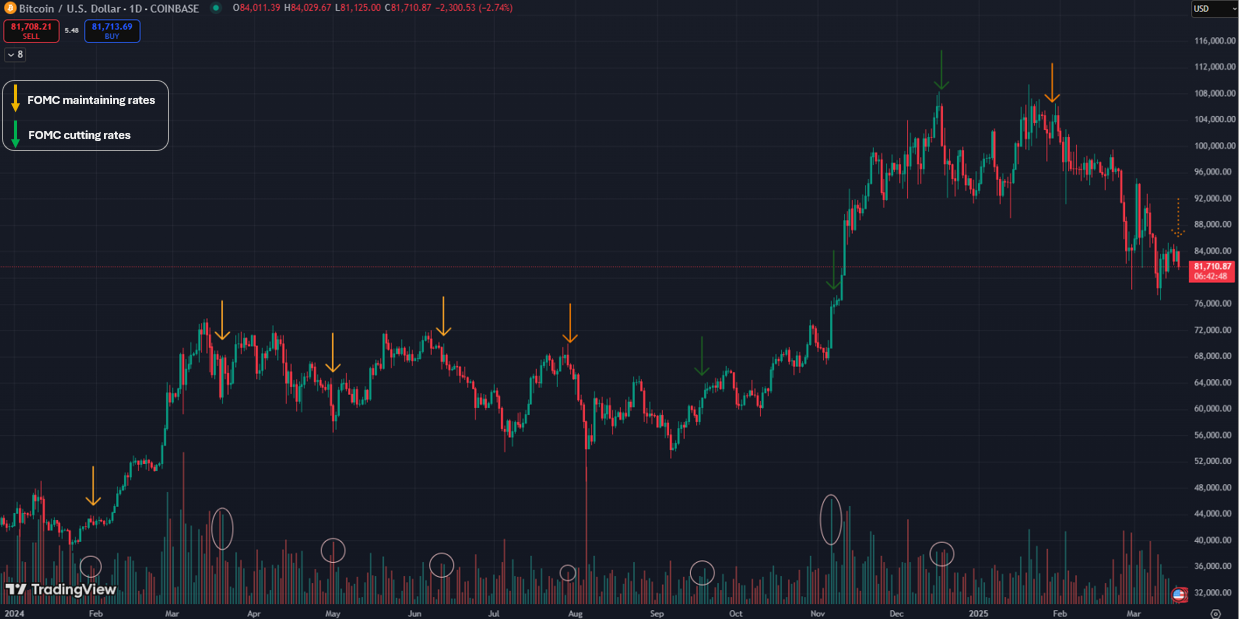
After the FOMC announcement, Bitcoin price tends to react sharply. Since the beginning of 2024, BTC prices mostly declined after the FOMC decided to maintain rates, as can be seen on the chart below. 

The notable exception was the pre-halving rally of February 2024, which also coincided with the launch of the first spot BTC ETFs. When US interest rates were cut on Sept. 18, 2024, and Nov. 7, 2024, Bitcoin rallied.

However, the third cut on Dec. 18, 2024, did not yield the same result. The modest decrease by 25 basis points to the 4.50%–4.75% range marked the local Bitcoin price top at $108,000.

Bitcoin price volatility ramps up around FOMC days — Will this time be different? image 0
BTC/USD 1-day chart with FOMC dates. Souce: Marie Poteriaieva, TradingView

Markets deleverage before FOMC, except this time

A key indicator that provides insight into market sentiment is Bitcoin open interest—the total number of derivative contracts, mostly $1 perpetual futures, that have not been settled.

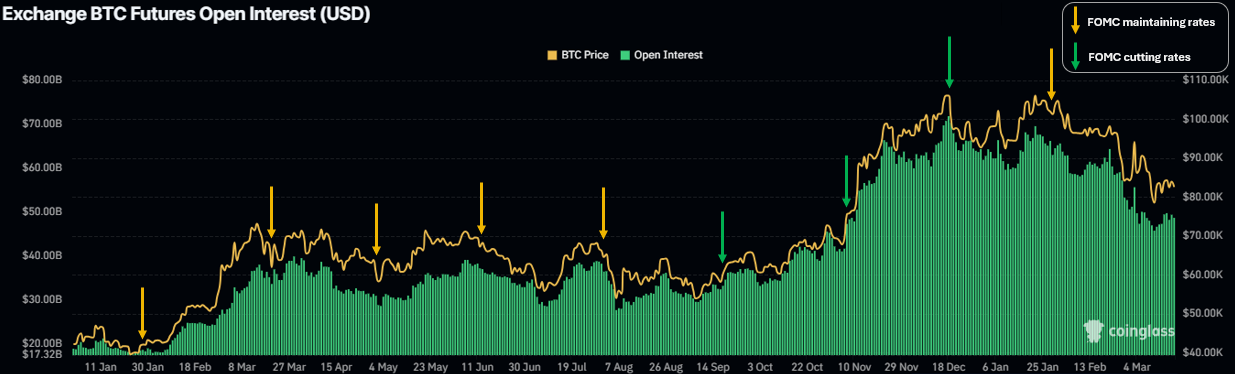
Historically, Bitcoin open interest falls before FOMC meetings, showing that traders are reducing leverage and risk exposure, as per the graph based on CoinGlass data.

Bitcoin price volatility ramps up around FOMC days — Will this time be different? image 1
Bitcoin futures open interest and FOMC dates. Source: Marie Poteriaieva, CoinGlass

However, this month, another pattern has emerged. Despite Bitcoin’s $12 billion open interest shakeout earlier this month, in the days preceding the FOMC there was no noticeable decrease in Bitcoin’s open interest. BTC price, however, declined, which is unusual and could indicate a strong directional bet.

This could also be a sign that traders feel less anxiety about the Fed’s decision, possibly expecting a neutral outcome. Supporting this view, CME Group’s FedWatch tool indicates a 99% probability that the Fed will maintain rates at 4.25%–4.50%.

If the rates remain unchanged, it is possible that Bitcoin price will continue its current downtrend. This may be exactly what the HyperLiquid whale was hoping for when it opened a 40x leveraged short position worth over $500 million at its peak. However, this position is now closed.

How are the spot Bitcoin ETFs reacting?

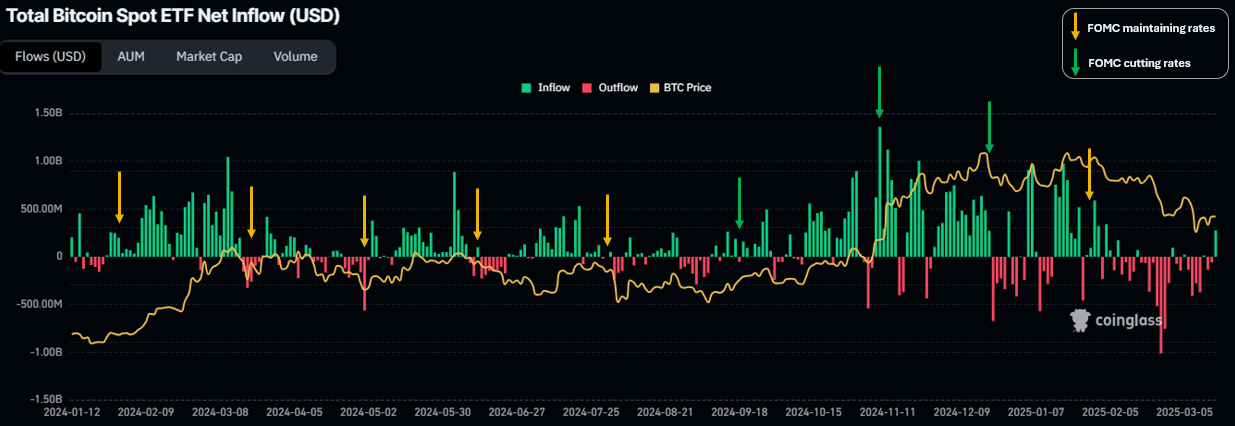
Unlike Bitcoin whales, investors in the spot Bitcoin ETFs have historically offloaded BTC holdings before FOMC meetings. 

Since the spot BTC ETFs launched in January 2024, most FOMC events have coincided with ETF outflows or, at best, modest inflows, according to CoinGlass data. The notable exception was the previous all-time high of January 2025, when even the spot Bitcoin ETF investors couldn’t resist the urge to buy.

Bitcoin price volatility ramps up around FOMC days — Will this time be different? image 2
Spot Bitcoin ETF net inflows and FOMC dates. Source: Marie Poteriaieva, CoinGlass

On March 17, the spot Bitcoin ETFs saw $275 million in net inflows, marking a shift from a month of outflows. This may signal a shift in investor sentiment and expectations regarding the Fed’s policy decisions.

If spot ETF inflows are rising before the FOMC, investors might be anticipating a more dovish stance from the Fed, such as signaling future rate cuts or maintaining liquidity-friendly policies.

Investors could also be loading up on Bitcoin as a hedge against uncertainty. This suggests that some institutional investors believe Bitcoin will perform well regardless of the Fed’s decision.

Investors could also be anticipating a possible short squeeze. If traders were expecting Bitcoin to drop and positioned short, a sudden increase in ETF inflows could play a role in traders’ behaviors and trigger a short squeeze.

Following the FOMC, BTC’s price action, along with onchain data and spot ETF flows will show whether the recent activity was part of a long-term accumulation trend or just speculative positioning. 

However, one thing that many traders agree on now is that BTC could experience a significant price movement after the FOMC announcement. As crypto trader Master of Crypto put it in a recent X post : 

“The FOMC is tomorrow, and a Big Move is expected.” 

Even without rate cuts, the chance of the Fed issuing dovish statements could lift markets, while the absence of them could drive prices lower.

This article does not contain investment advice or recommendations. Every investment and trading move involves risk, and readers should conduct their own research when making a decision.


11
9

Disclaimer: The content of this article solely reflects the author's opinion and does not represent the platform in any capacity. This article is not intended to serve as a reference for making investment decisions.

Understand the market, then trade.
Bitget offers one-stop trading for cryptocurrencies, stocks, and gold.
Trade now!

You may also like

ROI - For the Trump-led Treasury, the "tail" of the auction is the most difficult part: McKeever

The views expressed in this article are solely those of the author, Reuters columnist Jamie McGeever. Reuters, Orlando, Florida, October 6 – U.S. Treasury auctions are typically dull, predictable, and not newsworthy. But these are not ordinary times, and the Trump administration now faces the risk of sluggish U.S. debt sales making headlines. The U.S. Treasury plans to issue nearly $120 billion in Treasuries this week, the first non-bill bond sales in two weeks: $58 billion in three-year notes on Tuesday, $39 billion in ten-year notes on Wednesday, and $22 billion in thirty-year bonds on Thursday. These auctions would usually be insignificant events, but due to the exceptionally weak performance of auctions from September 22 to 24—especially the five-year note auction on September 23, which triggered the largest spike in bond yields since April last year—they are attracting growing attention. Since then, yields have not only failed to retreat but have surged across most tenors to multi-decade highs. It's worth noting that the possibility of a U.S. Treasury auction "failing" is almost zero. Primary dealers—currently 26 Wall Street banks and institutions authorized by the New York Fed as market makers for Treasuries—are always involved. They effectively underwrite the sales, ensuring the smooth operation of the $30 trillion U.S. Treasury market, the most liquid market in the world. This, in turn, allows the entire global financial system to function, given that trillions of dollars in global debt, assets, and market derivatives are benchmarked against U.S. Treasuries. Treasuries are also the primary collateral for lubricating the financial “pipes” of the U.S. and global markets, including repo agreements, interbank loans, and financing. In short, as long as U.S. Treasuries remain the pillar of the global financial system, there will always be buyers at Treasury auctions. The question, as always, is at what price these bonds will be sold. Currently, borrowing costs in the secondary market are at their highest levels since the mid-2000s, so it's reasonable to expect that the Treasury will pay relatively high rates in the primary market as well. But as recent auctions have shown, negative surprises remain possible. "Too big to be absorbed by the market"? The $70 billion five-year auction on September 23 was among the most worrisome in years. Demand, as measured by the bid-to-cover ratio, was at a nine-year low. The Treasury ended up selling the notes at a yield of 5.033%, more than 3 basis points above the market yield at the close of bidding. Three basis points might not sound like much, but it's exceptional for a five-year note auction. This is the largest so-called "tail" since June 2022. According to JPMorgan analysts, the last time a five-year auction had a three-basis-point tail was back in 2011—amid the brewing debt ceiling crisis that eventually led to a U.S. credit rating downgrade in August that year. Currently, concerns over the U.S.'s daunting fiscal outlook are driving up long-term borrowing costs. As a result, markets generally expect the Trump administration to gradually shift the Treasury’s massive funding needs toward the lower-yield (and therefore lower-cost) short- and medium-term segments of the curve. That's why the five-year note auction two weeks ago sparked such concern. A three-basis-point tail is common in long bond auctions, but not in the "belly" of the yield curve. If the Treasury is forced to pay a higher premium to issue these bonds, then Houston, we have a problem. A large auction tail can be caused by many factors, including market volatility on the day of the auction or more concerning, fundamental issues that may erode demand over time. The two are often hard to distinguish because they are not mutually exclusive. On a brighter note, this unease has not yet spread to the short end of the yield curve. At least, not yet. Three-year and ten-year Treasury yields are up about 50 basis points from the last auction a month ago, hovering around 4.96% and 5.32%, respectively. The thirty-year yield is up roughly 35 basis points to 5.65%. These levels should be high enough to attract strong demand and ensure smooth sales, right? Maybe. But if surprises do occur, volatility and uncertainty could spill over across the market. Investors will be watching developments as closely as hawks. (The views in this article are solely those of the author, a Reuters columnist.) Like this column? Check out Reuters' "Unhedged" (ROI), your essential new source for global finance commentary. Follow ROI on LinkedIn and X. You can also listen to the daily "Morning Bid" podcast on Apple, Spotify, or the Reuters app—subscribe for in-depth market and finance news, seven days a week. US 5-year auction has biggest 'tail' since 2022 https://fingfx.thomsonreuters.com/gfx/mkt/dwpkmkzogpm/TAIL.png (For the convenience of non-English speakers, Reuters provides automated translations of its reports

路透社•2026/10/06 13:11

Money market fund inflows plummet to 158 billion—Is short-term US Treasury liquidity flashing a warning sign?

Money market fund inflows have sharply dropped to $158 billion in the first three quarters of this year, driving Treasury yields higher. Increased volatility at the short end has raised market concerns about tightening short-term financing.

智通财经•2026/10/06 13:07