
Bitcoin Stuck in a Bear Trap? Why Analysts Believe a Surge Is Coming

Bitcoin may be in a classic bear trap, a phase seen in past cycles. Experts debate whether it will hit new highs or if the bull run has ended.
Bitcoin’s (BTC) price has historically experienced multiple bear traps. Depending on market conditions, these traps have appeared in short-term phases or larger timeframes.
Some analysts believe that Bitcoin is currently in such a bear trap and that a bull run will begin after the current phase ends.
What Does Bitcoin Bear Trap Cycle Mean?
A bear trap occurs when an asset’s price (such as stocks, cryptocurrencies, or indices) shows a sharp decline. This drop convinces investors that a bearish trend is starting. However, the price soon reverses and rises again, “trapping” those who sold short or exited their positions, expecting further declines.
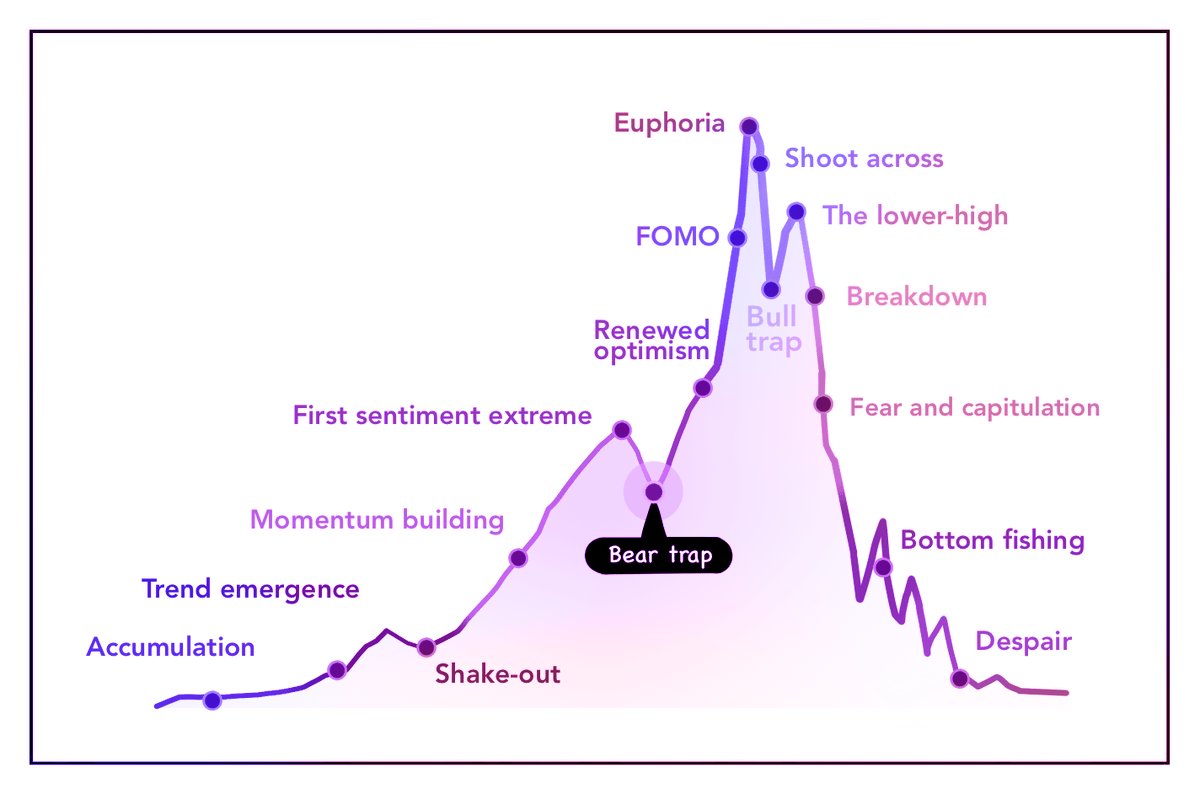 Psychological Stages of The Market. Source:
X
Psychological Stages of The Market. Source:
X
According to pseudonymous crypto analyst Finish, Bitcoin’s bull run cycles typically last around nine months. A bear trap often appears in the sixth month of the cycle. During this phase, Bitcoin’s price drops sharply, causing panic and sell-offs. But after that, the price recovers and reaches new highs.
Historical data from previous cycles—including 2011, 2013, 2017, 2021, and the current cycle (2024–2025)—show that this pattern repeats consistently.
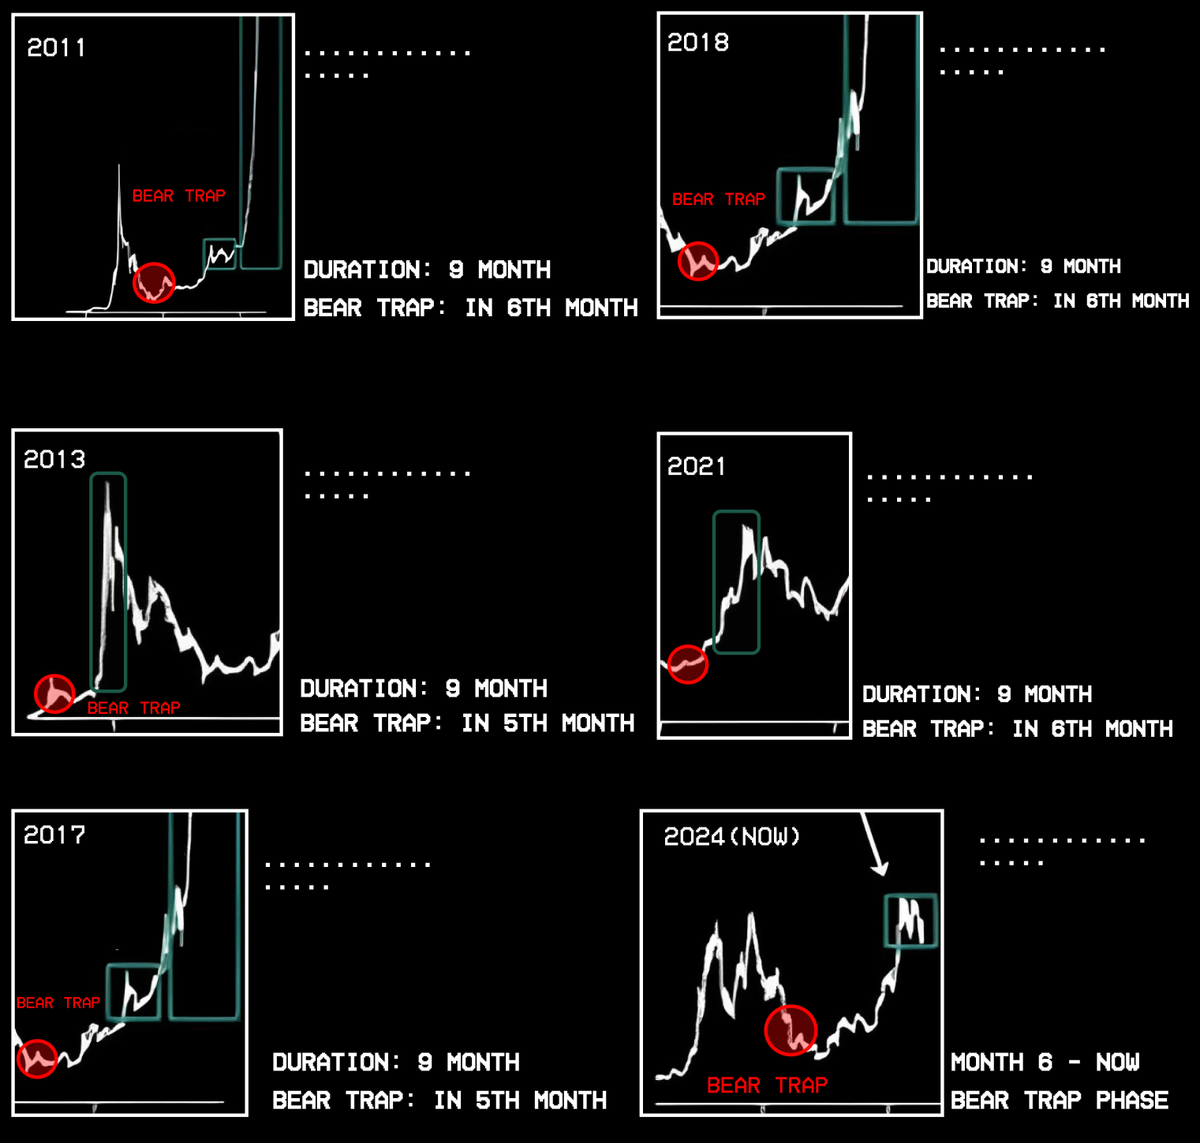 Bear Trap Phenomenon of
Bitcoin Price from 2011 – 2025. Source:
Finish
Bear Trap Phenomenon of
Bitcoin Price from 2011 – 2025. Source:
Finish
“2025 cycle is the same. Six-month bear trap, then a new ATH,” Finish predicted.
In his analysis, Finish also explains the driving forces behind bear traps in each cycle. For example, the 2013 bear trap was triggered by the shutdown of Silk Road, an online black market, and China’s ban on Bitcoin, which caused market panic.
In 2017, the ICO boom fueled Bitcoin’s bull run, pushing its price to $20,000. However, a bear trap emerged in the sixth month due to the launch of Bitcoin futures on the CME exchange. This was combined with media hype and concerns over Tether (USDT), which faced transparency issues.
Similarly, in 2021, Bitcoin soared to $69,000. But the six-month bear trap was triggered by an overheated market sentiment and Elon Musk’s sudden shift in stance on Bitcoin payments.
For the 2024–2025 cycle, Finish believes Bitcoin is currently in its bear trap phase. Macroeconomic factors, especially policies from US President Donald Trump, play a crucial role.
Trump’s policies—such as interest rate cuts, tariff war, and his pledge to make the US the “crypto capital” of the world—have created optimism but also caused short-term price volatility. This aligns with the six-month bear trap model described by Finish.
Additionally, analyst Danny agrees with this outlook. He predicts that Bitcoin’s biggest bull run will officially begin in April 2025 once the current bear trap phase ends. Danny suggests that Bitcoin could reach $300,000 by 2026.
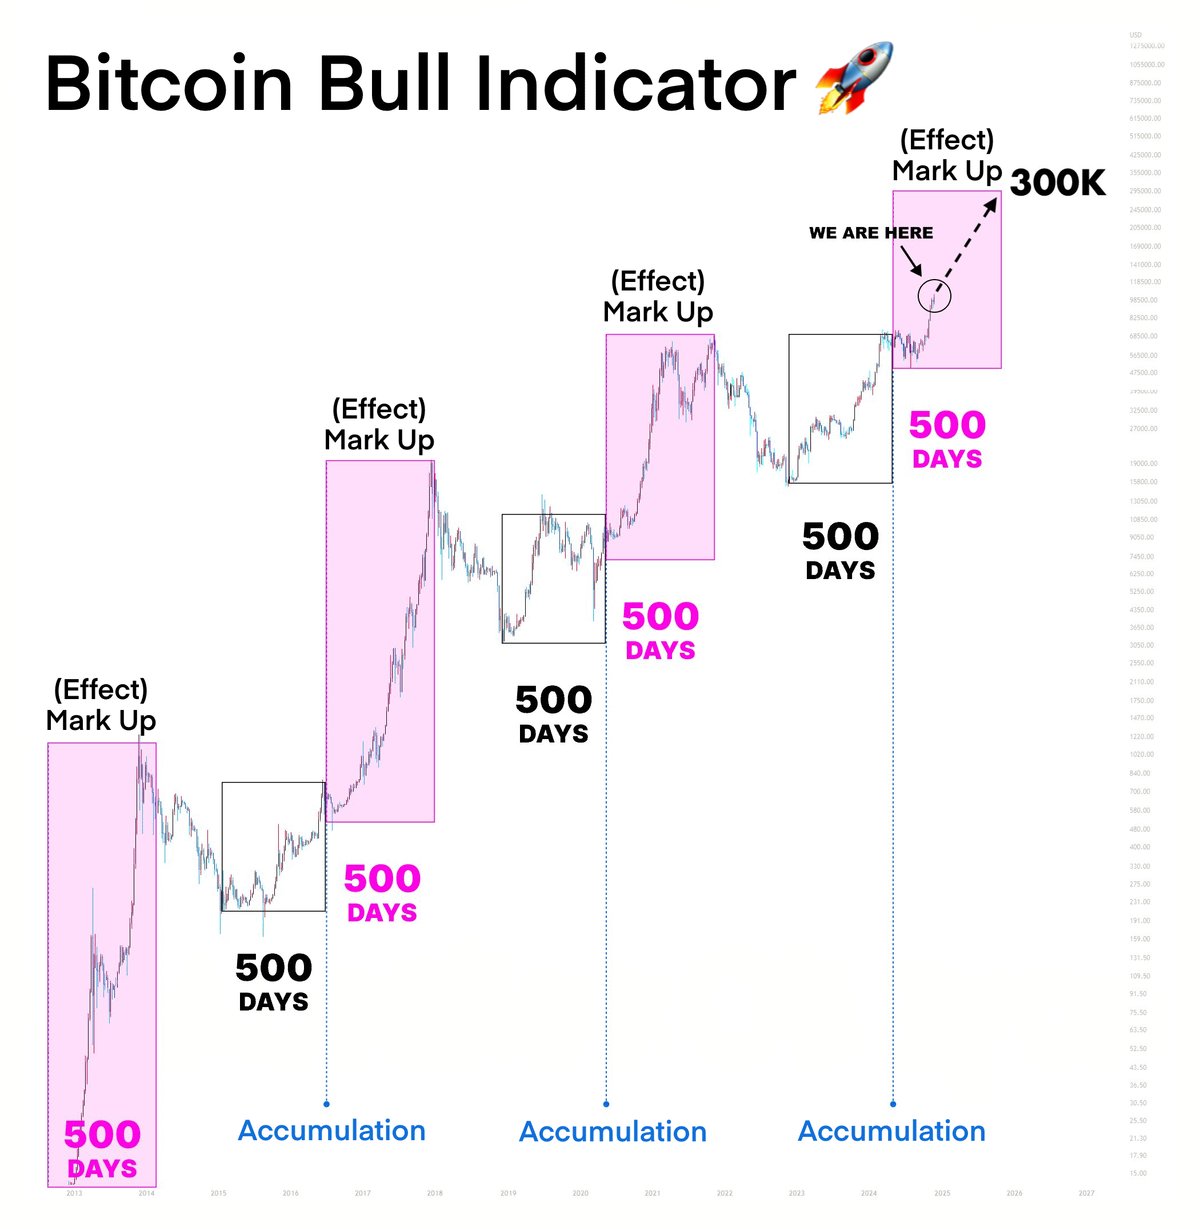 Bitcoin Price Performance Prediction 2025 – 2026. Source:
Danny.
Bitcoin Price Performance Prediction 2025 – 2026. Source:
Danny.
“We’re in the Markup phase, just past a classic bear trap. Historically, the biggest gains follow as Bitcoin dominance dips and capital shifts to mid- and low-cap tokens,” Danny predicted.
However, some analysts have lowered their expectations for Bitcoin’s growth. Ecoinometrics observes that Bitcoin’s growth rate in this cycle is significantly lower than in previous cycles. Ki Young Ju, founder of CryptoQuant, has analyzed Bitcoin’s PnL cycle signals and predicts that Bitcoin’s bull run has already ended.
Disclaimer: The content of this article solely reflects the author's opinion and does not represent the platform in any capacity. This article is not intended to serve as a reference for making investment decisions.
You may also like
XRP News Today : Ripple Expands Prime Brokerage Services for Brevan Howard
ROI - For the Trump-led Treasury, the "tail" of the auction is the most difficult part: McKeever
The views expressed in this article are solely those of the author, Reuters columnist Jamie McGeever. Reuters, Orlando, Florida, October 6 – U.S. Treasury auctions are typically dull, predictable, and not newsworthy. But these are not ordinary times, and the Trump administration now faces the risk of sluggish U.S. debt sales making headlines. The U.S. Treasury plans to issue nearly $120 billion in Treasuries this week, the first non-bill bond sales in two weeks: $58 billion in three-year notes on Tuesday, $39 billion in ten-year notes on Wednesday, and $22 billion in thirty-year bonds on Thursday. These auctions would usually be insignificant events, but due to the exceptionally weak performance of auctions from September 22 to 24—especially the five-year note auction on September 23, which triggered the largest spike in bond yields since April last year—they are attracting growing attention. Since then, yields have not only failed to retreat but have surged across most tenors to multi-decade highs. It's worth noting that the possibility of a U.S. Treasury auction "failing" is almost zero. Primary dealers—currently 26 Wall Street banks and institutions authorized by the New York Fed as market makers for Treasuries—are always involved. They effectively underwrite the sales, ensuring the smooth operation of the $30 trillion U.S. Treasury market, the most liquid market in the world. This, in turn, allows the entire global financial system to function, given that trillions of dollars in global debt, assets, and market derivatives are benchmarked against U.S. Treasuries. Treasuries are also the primary collateral for lubricating the financial “pipes” of the U.S. and global markets, including repo agreements, interbank loans, and financing. In short, as long as U.S. Treasuries remain the pillar of the global financial system, there will always be buyers at Treasury auctions. The question, as always, is at what price these bonds will be sold. Currently, borrowing costs in the secondary market are at their highest levels since the mid-2000s, so it's reasonable to expect that the Treasury will pay relatively high rates in the primary market as well. But as recent auctions have shown, negative surprises remain possible. "Too big to be absorbed by the market"? The $70 billion five-year auction on September 23 was among the most worrisome in years. Demand, as measured by the bid-to-cover ratio, was at a nine-year low. The Treasury ended up selling the notes at a yield of 5.033%, more than 3 basis points above the market yield at the close of bidding. Three basis points might not sound like much, but it's exceptional for a five-year note auction. This is the largest so-called "tail" since June 2022. According to JPMorgan analysts, the last time a five-year auction had a three-basis-point tail was back in 2011—amid the brewing debt ceiling crisis that eventually led to a U.S. credit rating downgrade in August that year. Currently, concerns over the U.S.'s daunting fiscal outlook are driving up long-term borrowing costs. As a result, markets generally expect the Trump administration to gradually shift the Treasury’s massive funding needs toward the lower-yield (and therefore lower-cost) short- and medium-term segments of the curve. That's why the five-year note auction two weeks ago sparked such concern. A three-basis-point tail is common in long bond auctions, but not in the "belly" of the yield curve. If the Treasury is forced to pay a higher premium to issue these bonds, then Houston, we have a problem. A large auction tail can be caused by many factors, including market volatility on the day of the auction or more concerning, fundamental issues that may erode demand over time. The two are often hard to distinguish because they are not mutually exclusive. On a brighter note, this unease has not yet spread to the short end of the yield curve. At least, not yet. Three-year and ten-year Treasury yields are up about 50 basis points from the last auction a month ago, hovering around 4.96% and 5.32%, respectively. The thirty-year yield is up roughly 35 basis points to 5.65%. These levels should be high enough to attract strong demand and ensure smooth sales, right? Maybe. But if surprises do occur, volatility and uncertainty could spill over across the market. Investors will be watching developments as closely as hawks. (The views in this article are solely those of the author, a Reuters columnist.) Like this column? Check out Reuters' "Unhedged" (ROI), your essential new source for global finance commentary. Follow ROI on LinkedIn and X. You can also listen to the daily "Morning Bid" podcast on Apple, Spotify, or the Reuters app—subscribe for in-depth market and finance news, seven days a week. US 5-year auction has biggest 'tail' since 2022 https://fingfx.thomsonreuters.com/gfx/mkt/dwpkmkzogpm/TAIL.png (For the convenience of non-English speakers, Reuters provides automated translations of its reports
Crypto prices
More


