

- Mubarak (MUBARAK) is consolidating near $0.150-$0.160, a crucial support zone that could trigger a breakout toward $0.200-$0.220 if buying momentum returns.
- The $0.175-$0.180 resistance level remains a key hurdle, with a breakout potentially pushing prices toward the $0.290 maximum target for 2025.
- Failure to hold above $0.120 could signal bearish momentum, leading to extended consolidation before another rally attempt.
Mubarak (MUBARAK) is a meme-based cryptocurrency that recently gained traction in the market. It was launched around March 12, 2025, on the Binance Smart Chain (BSC) . The name “Mubarak,” meaning “blessed” in Arabic, reflects its cultural roots.
The token’s launch coincided with a major $2 billion investment from Abu Dhabi’s MGX into Binance. This marked a significant moment in the crypto industry, symbolizing the growing influence of Middle Eastern capital. The choice of the name “Mubarak” connects the project with its cultural and financial backing.
Table of contents
- Market performance
- Community and social media influence
- Mubarak (MUBARAK) Price Prediction 2025-2030 Overview
- Mubarak (MUBARAK) 2025 Price Prediction Analysis
- Technical Overview for 2025:
- Bullish Case: Path to $0.290
- Bearish Case: Retesting Lower Support
- Mubarak (MUBARAK) Price Prediction for 2026
- Mubarak (MUBARAK) Price Prediction for 2027
- Mubarak (MUBARAK) Price Prediction for 2028
- Mubarak (MUBARAK) Price Prediction for 2029
- Mubarak (MUBARAK) Price Prediction for 2030
- FAQs
Market performance
Since its launch, Mubarak has experienced rapid growth. As of March 18, 2025, the token’s price is around $0.1677, reflecting a 75.98% increase in 24 hours. Its market capitalization has reached $167.70 million, with a 24-hour trading volume of $445.63 million. The circulating supply stands at 1 billion tokens, which is also its total and maximum supply.
Community and social media influence
The token gained traction through a strong community and strategic social media activity. Binance founder Changpeng Zhao (CZ) played a key role in amplifying its visibility. His interactions on social platforms, including sharing community-generated memes and subtle endorsements, fueled investor interest and contributed to its growth.
Mubarak (MUBARAK) Price Prediction 2025-2030 Overview
| Year | Min. Price | Avg. Price | Max. Price |
| 2025 | $0.120 | $0.185 | $0.290 |
| 2026 | $0.050 | $0.095 | $0.155 |
| 2027 | $0.060 | $0.085 | $0.125 |
| 2028 | $0.095 | $0.175 | $0.280 |
| 2029 | $0.230 | $0.365 | $0.590 |
| 2030 | $0.100 | $0.185 | $0.280 |
Mubarak (MUBARAK) 2025 Price Prediction Analysis
 Mubarak (MUBARAK) price analysis 2025 (Source: TradingView
)
Mubarak (MUBARAK) price analysis 2025 (Source: TradingView
)
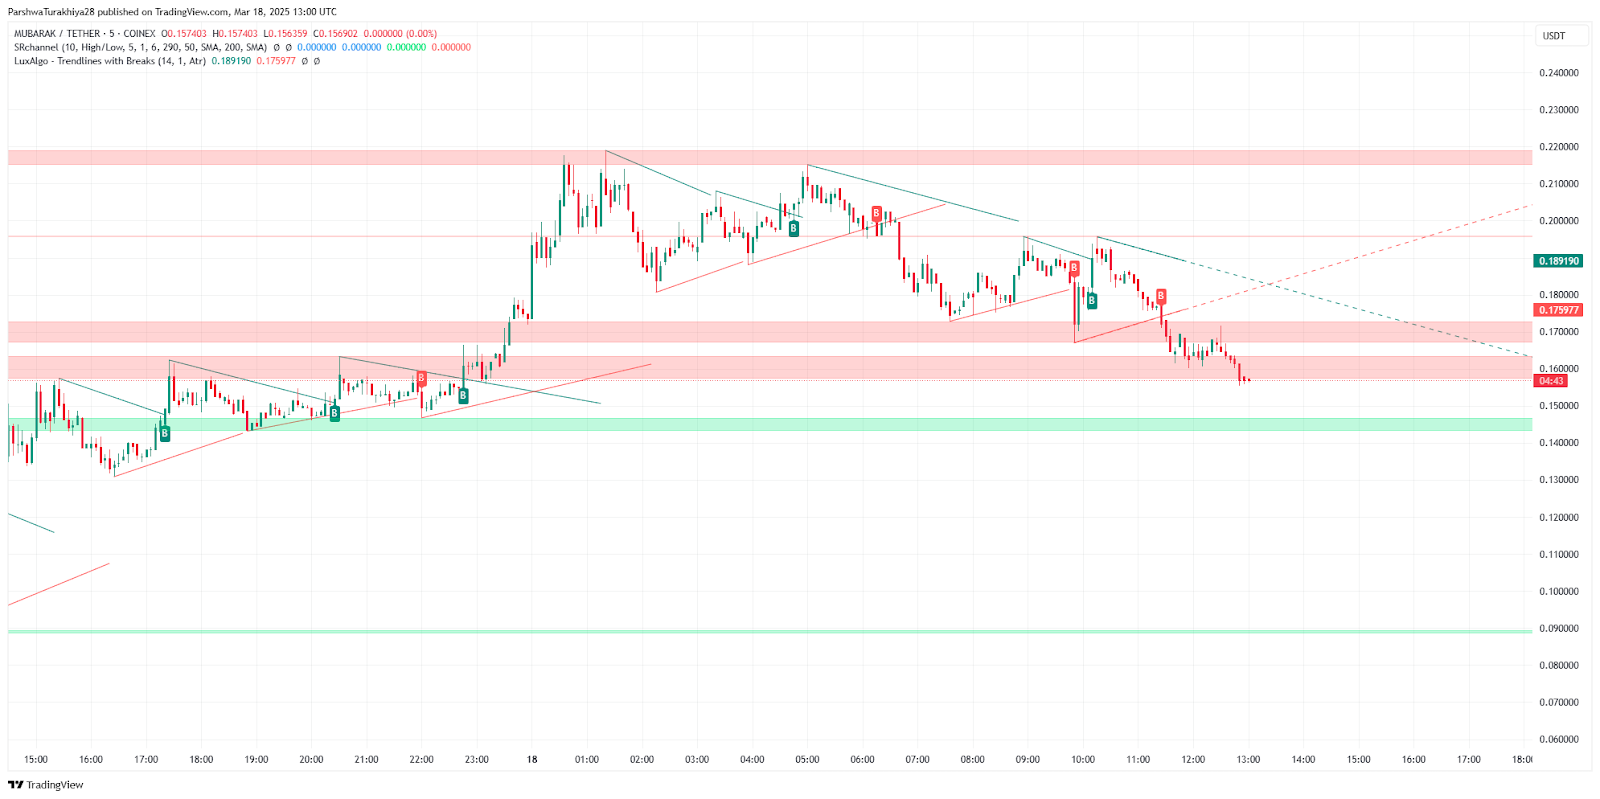
Mubarak (MUBARAK) is currently experiencing a consolidation phase after a recent breakout, as seen in the provided chart. The price has been fluctuating within key resistance and support levels, indicating potential accumulation before a larger move. The minimum expected price for 2025 is $0.120, while the average projected price is $0.185, and a bullish breakout could push MUBARAK to a high of $0.290.
Technical Overview for 2025:
- Support Levels: The green support zone near $0.150-$0.160 is critical, where buyers could accumulate. If this level holds, it may act as a foundation for an upward move. A breakdown below $0.120 would signal bearish momentum.
- Resistance Levels: The nearest resistance sits around $0.175-$0.180, which has acted as a previous rejection point. A sustained breakout above this could push MUBARAK towards $0.200-$0.220 in mid-2025. The final major resistance for the year lies at $0.290, the projected maximum price.
- Trend Analysis: The market is showing a potential downtrend following a strong rally, but if price stabilizes and volume increases, a reversal toward $0.185-$0.200 could occur.
Bullish Case: Path to $0.290
If buying momentum returns and MUBARAK surpasses $0.180-$0.200, it could indicate the start of an extended uptrend. With broader market growth and positive sentiment, a rally toward $0.290 is achievable, breaking previous highs.
Bearish Case: Retesting Lower Support
A failure to hold above $0.150 could lead to a retest of $0.120, where strong buyers need to step in to prevent further decline. A break below $0.120 would invalidate the bullish scenario, leading to extended consolidation or a downtrend.
Mubarak (MUBARAK) Price Prediction for 2026
After a strong performance in 2025, MUBARAK is expected to experience a significant decline in 2026, with prices ranging from $0.050 to $0.155 and an average price of $0.095. This drop could be due to market corrections, reduced investor confidence, or overall weakness in the crypto sector. If the price struggles to hold above $0.080, further downside toward $0.050 is possible before the market stabilizes. However, if sentiment improves, the token could reclaim the $0.120-$0.130 range, forming a new support base for future growth.
Mubarak (MUBARAK) Price Prediction for 2027
MUBARAK is expected to see stability and slower growth in 2027, with a projected minimum price of $0.060 and a maximum of $0.125. Market sentiment could shift toward accumulation, leading to sideways trading around $0.085 on average. If demand returns, the token may test $0.110-$0.125, but if it struggles to maintain upward momentum, it could revisit the $0.060-$0.070 range. Long-term investors might take this period as a chance to accumulate ahead of potential future rallies.
Mubarak (MUBARAK) Price Prediction for 2028
With the crypto market likely entering another bullish cycle, MUBARAK could see significant recovery in 2028. The projected price range is $0.095 to $0.280, with an average trading price of $0.175. If buying pressure strengthens, MUBARAK may surpass previous resistance levels at $0.200, signaling renewed investor confidence. A breakout above $0.250 could push it toward the yearly high of $0.280, provided market conditions remain favorable.
Mubarak (MUBARAK) Price Prediction for 2029
MUBARAK is forecasted to experience strong upward momentum in 2029, trading between $0.230 and $0.590, with an average price of $0.365. This growth could be fueled by mass adoption, increased use cases, or major partnerships. If bulls dominate the market, the price could test $0.500-$0.590, but if there’s resistance, consolidation around $0.320-$0.350 is more likely.
Mubarak (MUBARAK) Price Prediction for 2030
By 2030, MUBARAK is expected to stabilize after its peak in 2029, with prices fluctuating between $0.100 and $0.280 and an average value of $0.185. Market dynamics may shift, leading to profit-taking or market corrections. If strong fundamentals support the token, it could maintain its higher levels, but if selling pressure increases, a drop toward $0.120-$0.140 might be seen before another potential long-term rally.
FAQs
The projected range is $0.120 to $0.290, with an average price of $0.185 if market conditions remain favorable.
Increased investor interest, strong community support, and Binance-related developments could drive demand and push the price higher.
The primary resistance levels are $0.175-$0.180 and $0.220, with $0.290 as the final upside target.
A break below $0.120 could indicate a shift toward bearish sentiment, possibly leading to consolidation before another upward attempt.
The $2 billion MGX investment into Binance has strengthened investor confidence, indirectly boosting MUBARAK’s adoption and price potential.
The price action shows a consolidation phase with potential for an uptrend if resistance at $0.175-$0.180 is broken.
While $0.290 is the projected high, reaching $0.300 would require an extended rally supported by increased liquidity and trading volume.
The $0.150-$0.160 support zone has shown strong buying interest, making it an ideal range for accumulation.
High engagement from Binance’s CZ and strategic meme-driven marketing have played a major role in its price volatility and investor sentiment.
A sharp decline could occur if whale sell-offs, weak trading volume, or loss of community interest lead to a drop below $0.120.
Disclaimer: The information presented in this article is for informational and educational purposes only. The article does not constitute financial advice or advice of any kind. Coin Edition is not responsible for any losses incurred as a result of the utilization of content, products, or services mentioned. Readers are advised to exercise caution before taking any action related to the company.


