

- Pepe (PEPE) is projected to trade between $0.000014 and $0.000060 in 2025, with an average target of $0.000042.
- Breaking past $0.000010 – $0.000012 resistance could trigger an upward move toward $0.000030 – $0.000042.
- Failure to hold support near $0.000007500 – $0.000007700 may lead to deeper consolidation before a recovery.
Pepe (PEPE) is a meme-based cryptocurrency inspired by the popular internet meme, Pepe the Frog. Launched in April 2023, it quickly gained attention in the meme coin space, joining the ranks of Dogecoin and Shiba Inu.
Table of contents
- Origins and Purpose
- Tokenomics
- Market Performance
- Community and Cultural Impact
- Pepe (PEPE) Price Prediction 2025-2030 Overview
- Bollinger Band Analysis for Pepe (PEPE)
- MACD Analysis for Pepe (PEPE)
- Relative Strength Index (RSI) Analysis for Pepe (PEPE)
- Support and resistance levels for Pepe (PEPE)
- Pepe (PEPE) 2025 Price Prediction Analysis
- Bullish Case: Path Toward $0.000060
- Bearish Case: Retesting Lower Support
- Key Levels to Watch in 2025
- Pepe (PEPE) Price Prediction for 2026
- Pepe (PEPE) Price Prediction for 2027
- Pepe (PEPE) Price Prediction for 2028
- Pepe (PEPE) Price Prediction for 2029
- Pepe (PEPE) Price Prediction for 2030
- FAQs
Origins and Purpose
PEPE was introduced without a presale, taxes, or centralized ownership. The project focuses on being a community-driven token, leveraging internet culture and memes. It was created with the idea of reviving the excitement around meme coins without promising financial returns or specific use cases.
Tokenomics
PEPE operates as an ERC-20 token on the Ethereum blockchain. The total supply is set at 420.69 trillion tokens. About 93.1% of the supply was locked in a liquidity pool on Uniswap, and the liquidity provider tokens were burned to ensure they cannot be retrieved. The remaining 6.9% is held in a multi-signature wallet for future use in exchange listings, bridges, and liquidity pools.
Market Performance
As of March 2025, PEPE is trading around $0.000007 per token with a market capitalization exceeding $2.8 billion. The 24-hour trading volume is near $787 million, indicating strong market activity.
Community and Cultural Impact
PEPE thrives on community engagement and meme culture. While it has no official connection to the original creator of Pepe the Frog, the token’s popularity comes from the widespread recognition of the meme. The community plays a crucial role in its growth and adoption.
Pepe (PEPE) Price Prediction 2025-2030 Overview
| Year | Potential Low ($) | Potential Average ($) | Potential High ($) |
| 2025 | 0.000014 | 0.000042 | 0.00006 |
| 2026 | 0.000035 | 0.000053 | 0.000072 |
| 2027 | 0.000045 | 0.000063 | 0.000083 |
| 2028 | 0.000067 | 0.000085 | 0.000102 |
| 2029 | 0.000088 | 0.000099 | 0.000115 |
| 2030 | 0.000105 | 0.000122 | 0.00014 |
Bollinger Band Analysis for Pepe (PEPE)
 Pepe (PEPE) price chart (Source: TradingView
)
Pepe (PEPE) price chart (Source: TradingView
)
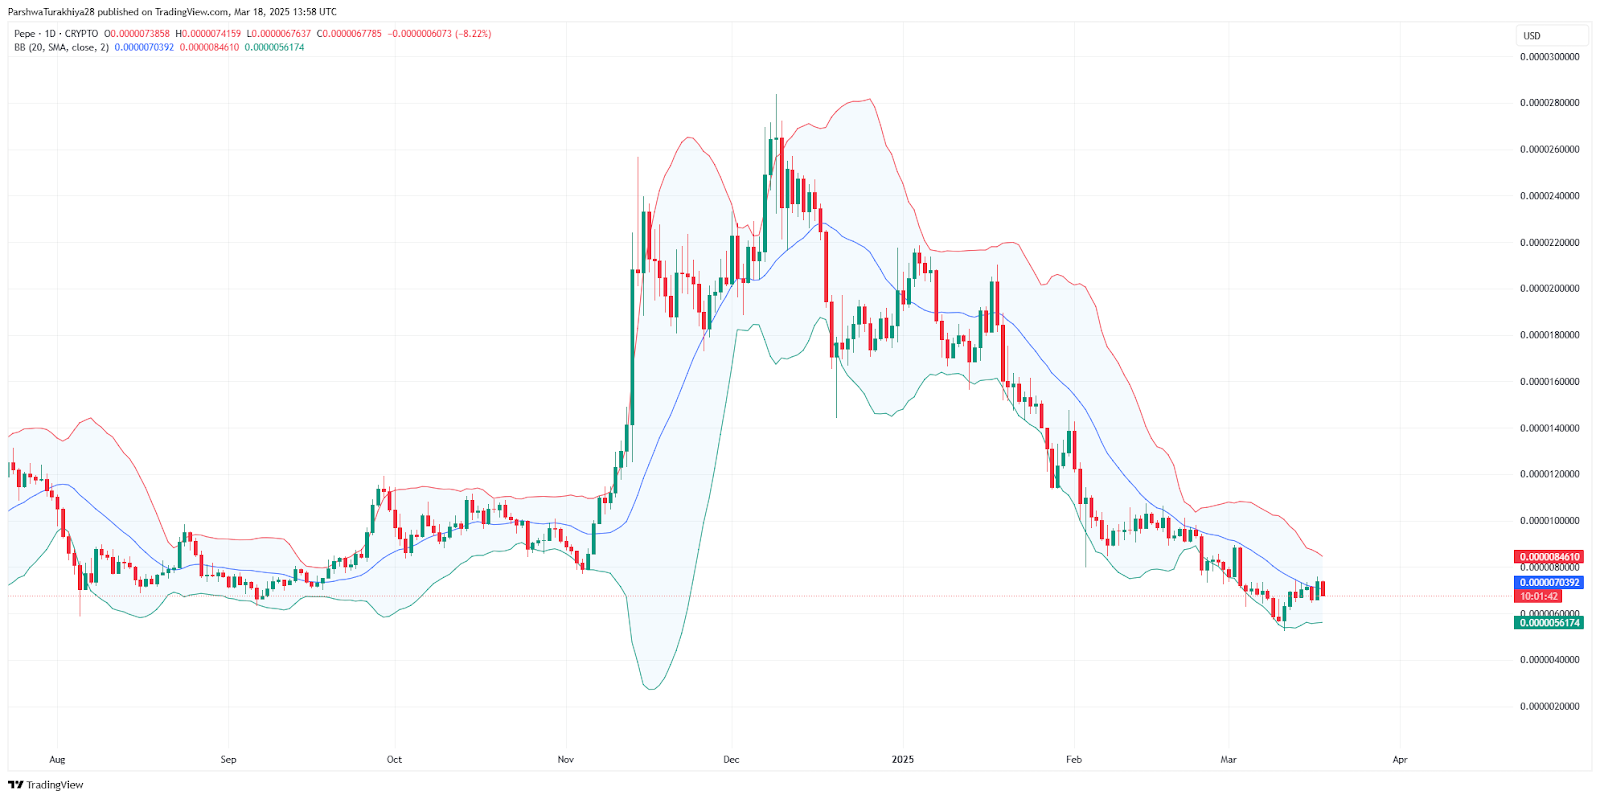
The Bollinger Bands for PEPE show a contraction in volatility, as the price is currently moving near the lower band at $0.0000005617, which historically acts as a support level. The middle band (20-day simple moving average) is at $0.0000007039, acting as the first hurdle for price recovery.
If PEPE breaks above the middle Bollinger Band ($0.0000007039) and sustains, it would confirm an early uptrend, pushing the price toward the upper band at $0.0000008460. This upper band acts as a dynamic resistance level, meaning PEPE needs strong buying pressure to close above it.
Historically, when PEPE has tested the lower Bollinger Band, a bounce has followed. However, if it breaks below $0.0000005600, it may indicate a volatility expansion to the downside, leading to a deeper correction. Conversely, a price breakout above the upper band would indicate strong bullish momentum, allowing PEPE to reclaim $0.0000009000 – $0.0000011000 in the near term.
MACD Analysis for Pepe (PEPE)
 Pepe (PEPE) price chart (Source: TradingView
)
Pepe (PEPE) price chart (Source: TradingView
)
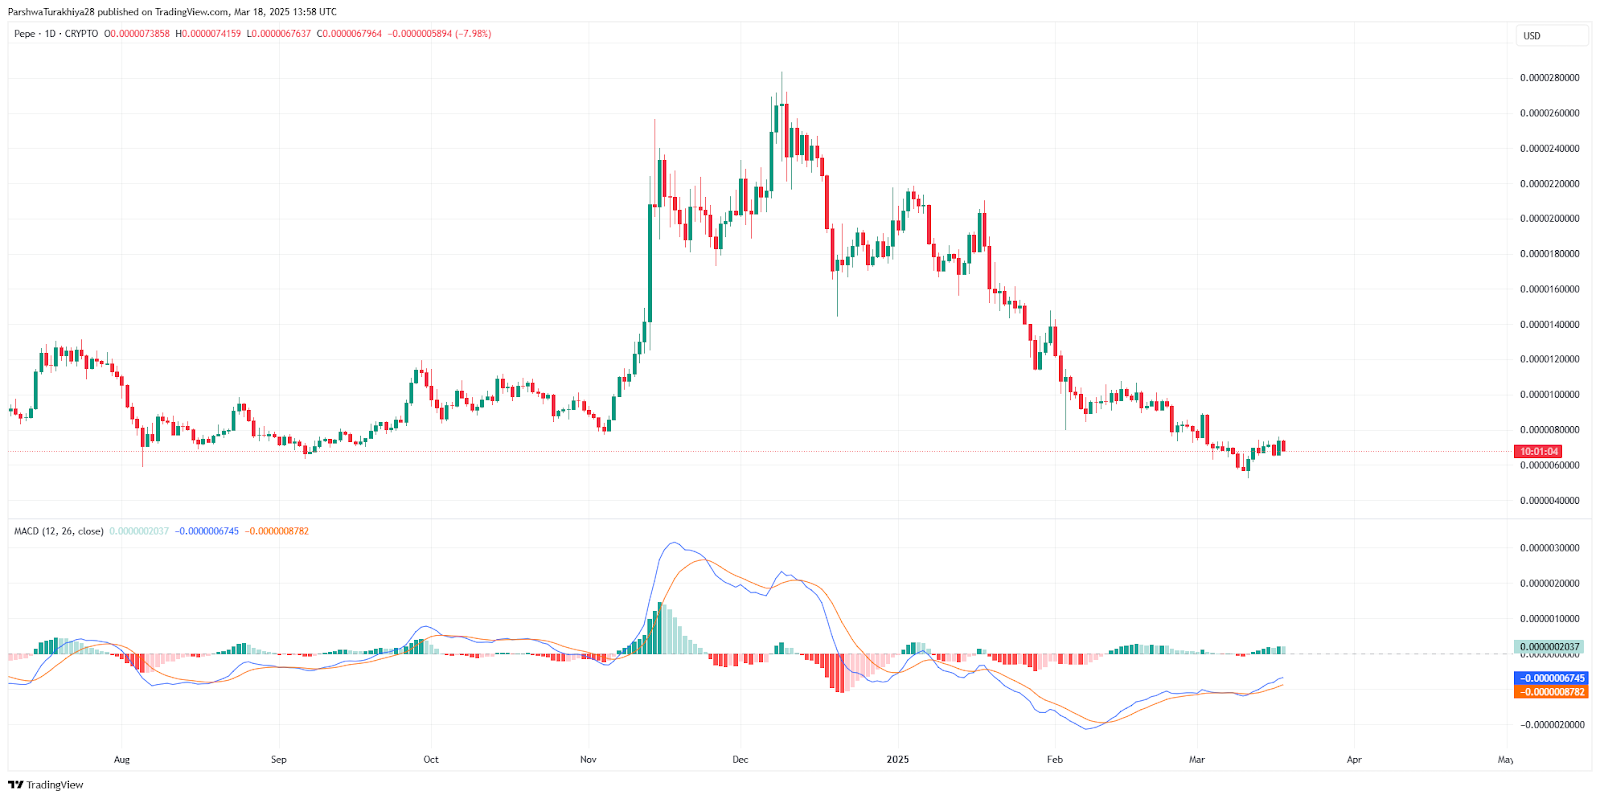
The MACD indicator on the daily timeframe presents early signs of a bullish crossover, as the MACD line (-0.0000006745) is starting to move closer to the signal line (-0.0000008782).** This suggests that selling momentum is weakening, and a potential shift toward an uptrend could be forming.
A confirmed bullish crossover would occur if the MACD line crosses above the signal line, ideally accompanied by an increase in the histogram bars turning positive. This would indicate a build-up in buying momentum, potentially pushing PEPE toward the $0.0000009000 – $0.0000011000 resistance levels.
If the MACD crossover fails and the histogram turns negative again, it could indicate a continuation of the downtrend, leading to a possible retest of the $0.0000005600 – $0.0000005800 support zone. A bearish continuation would be confirmed if the MACD line drops further below the signal line, signaling increased selling pressure.
For bullish confirmation, traders should look for MACD turning positive above -0.0000005000, along with increasing green histogram bars, signaling renewed strength in buying pressure.
Relative Strength Index (RSI) Analysis for Pepe (PEPE)
 Pepe (PEPE) price dynamics (Source: TradingView
)
Pepe (PEPE) price dynamics (Source: TradingView
)
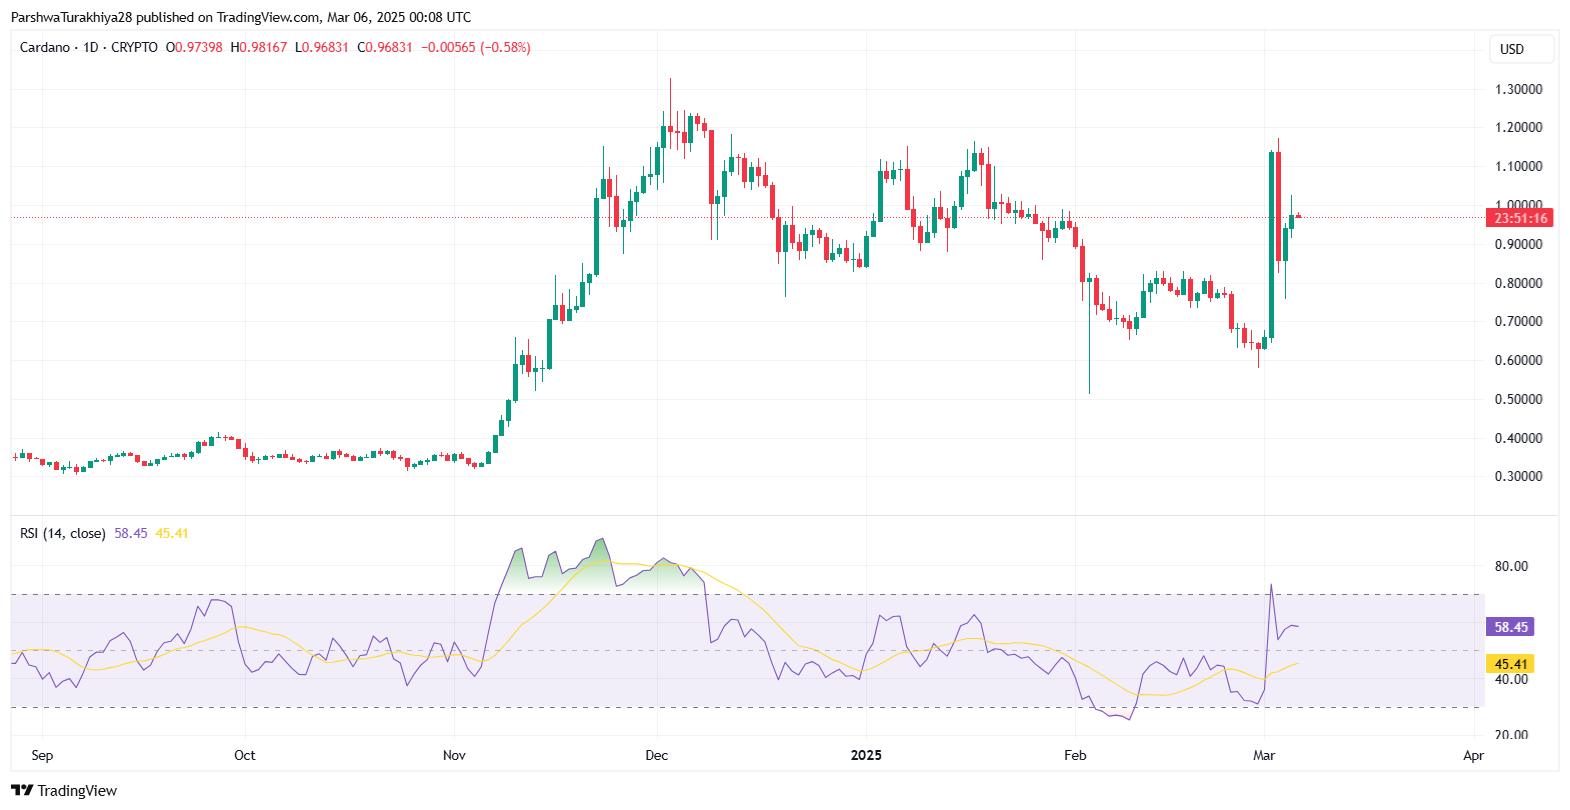
The RSI indicator for PEPE is currently hovering around 43.01, which is below the neutral 50 level, suggesting that momentum is still weak. Historically, RSI levels below 40 indicate oversold conditions, signaling potential buying opportunities if the price stabilizes.
In the past, whenever RSI dipped into the 30-35 zone, a price reversal followed due to increased buying interest. If RSI moves above 50-55, it would confirm a shift toward bullish strength, indicating increased momentum. A breakout beyond 65-70 would validate strong buying pressure, allowing PEPE to reclaim higher resistance zones.
However, if RSI remains below 40, it suggests bearish continuation, meaning the price could continue consolidating or retesting lower support levels. The best-case scenario for bulls would be RSI trending above 55, accompanied by higher trading volume, which would confirm strength in the ongoing trend.
Support and resistance levels for Pepe (PEPE)
 Pepe (PEPE) price chart (Source: TradingView
)
Pepe (PEPE) price chart (Source: TradingView
)
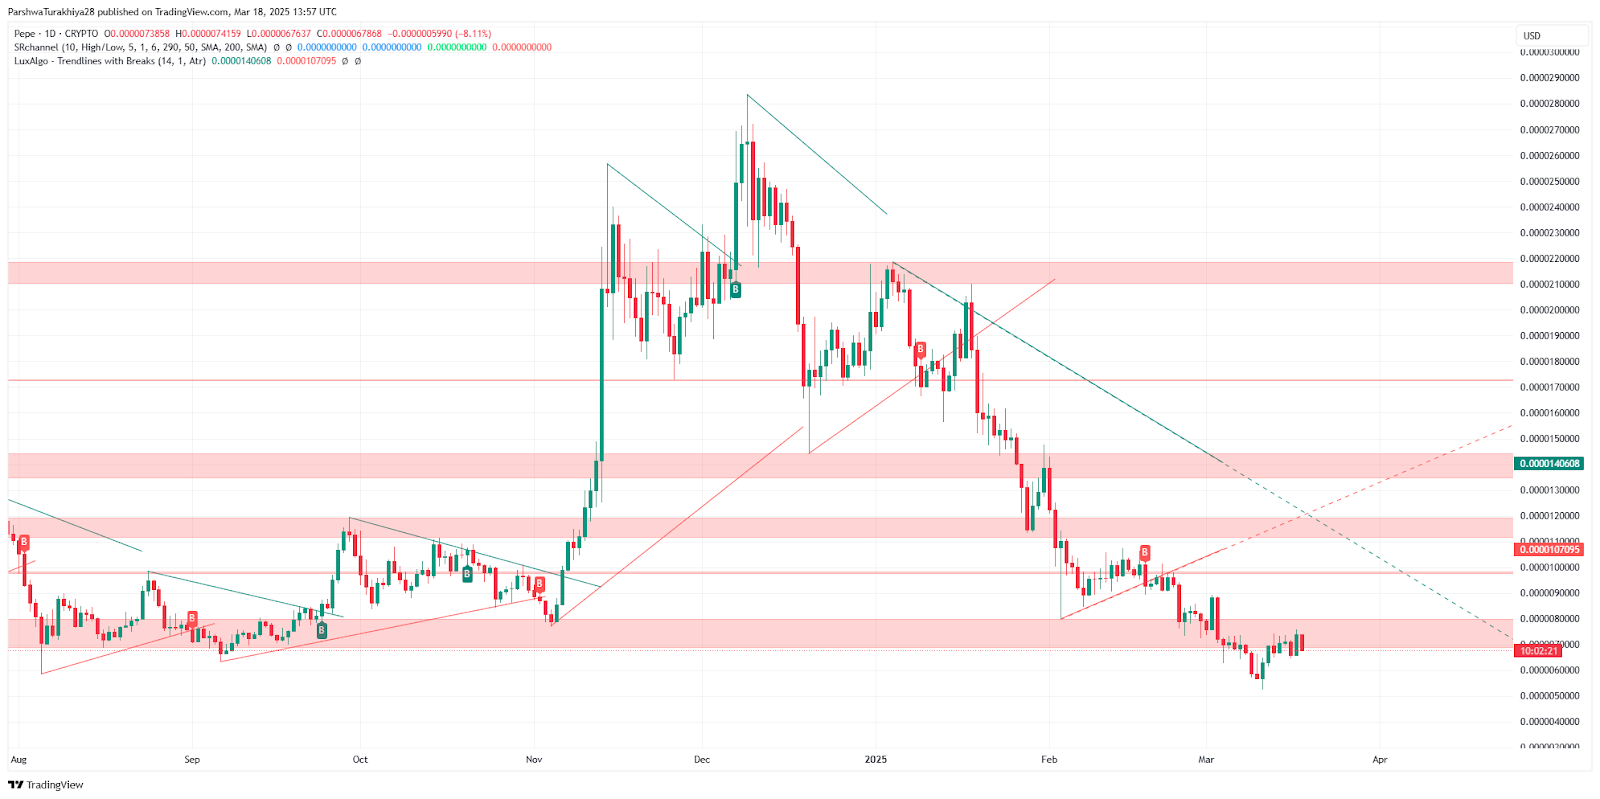
The price chart for PEPE indicates well-defined support and resistance zones that are critical for future price action. The key support levels are at $0.0000005600 – $0.0000005700, which represents a strong accumulation zone where buyers previously stepped in to prevent further downside. If this level fails, a deeper retracement toward $0.0000005000 – $0.0000005200 could be expected, potentially marking the bottom for the ongoing corrective phase.
On the resistance side, the first immediate hurdle lies at $0.0000008500 – $0.0000009000, which aligns with a previously rejected level during the last rally. A successful breakout above this resistance could push PEPE toward $0.0000011000 – $0.0000012000, marking a mid-term bullish reversal. A break above $0.0000014000, which aligns with a past supply zone, could further accelerate price movement towards the $0.0000020000 range. If PEPE manages to reclaim these resistance levels with strong volume, the possibility of testing all-time highs remains viable.
Currently, the price is consolidating in a demand zone, meaning buyers need to defend this region to prevent further downside. A break below the key support at $0.0000005600 would indicate prolonged bearish conditions, while a break above $0.0000009000 would be an early sign of bullish momentum returning.
Pepe (PEPE) 2025 Price Prediction Analysis
 Pepe (PEPE) price analysis 2025 (Source: TradingView
)
Pepe (PEPE) price analysis 2025 (Source: TradingView
)
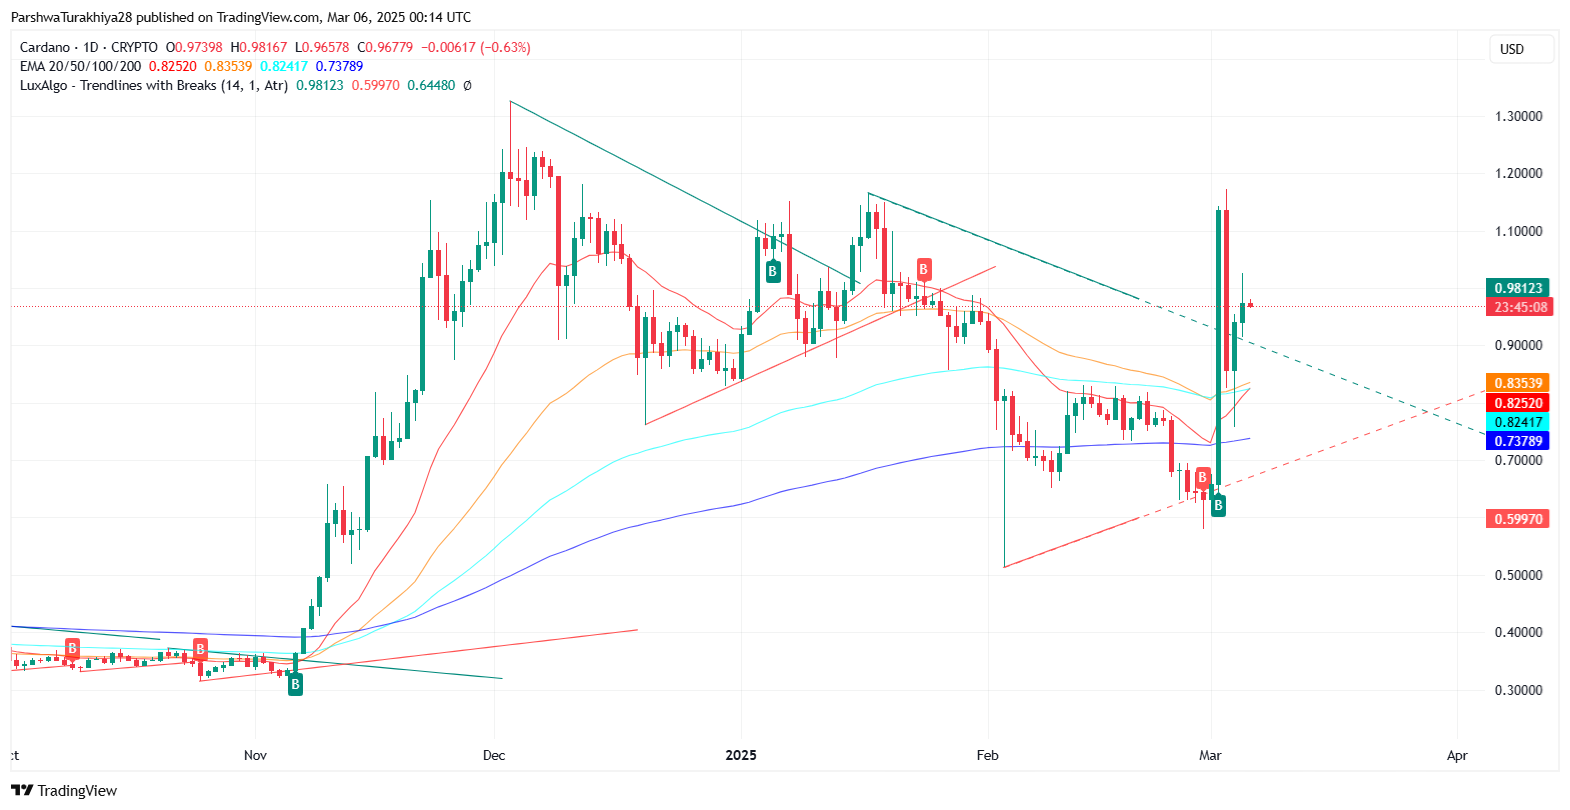
Pepe (PEPE) is currently consolidating within a downtrend after experiencing a significant rally in the past. The chart shows that PEPE is trading below key moving averages, with strong resistance levels ahead. Based on the projected price levels for 2025, PEPE could experience a range between $0.000014 (potential low) and $0.000060 (potential high), with an expected average trading price of $0.000042.
Bullish Case: Path Toward $0.000060
If PEPE manages to break through the $0.000010 – $0.000012 resistance zone, it could enter a bullish reversal phase. The next key resistance stands at $0.000014, which aligns with a historically strong level. A successful breakout above this level would open the door for a move toward $0.000030 – $0.000042, the expected mid-range price for 2025. If market sentiment improves significantly and meme tokens regain popularity, PEPE could test the $0.000060 mark by the end of the year.
The 200-day EMA, currently at $0.0000114819, is an important indicator of long-term trend direction. If PEPE reclaims this level and turns it into support, it could act as a launchpad for further upside. A surge in buying volume and a return of speculative interest in meme coins could accelerate PEPE’s climb toward its upper target.
Bearish Case: Retesting Lower Support
On the downside, if PEPE fails to sustain momentum and breaks below the $0.000007500 – $0.000007700 support zone, it could test $0.000006500 – $0.000007000 as the next key support area. A further decline would bring the $0.000005500 – $0.000006000 range into play, which has previously acted as a strong demand zone.
If selling pressure persists and market sentiment weakens, PEPE could drop to its projected 2025 low of $0.000014 before rebounding. However, as long as this level holds, the possibility of recovery remains intact, and PEPE could trade in a consolidation phase before moving higher.
Key Levels to Watch in 2025
- Support Levels: $0.000007500 – $0.000007700 (immediate support), $0.000006500 – $0.000007000 (critical support).
- Resistance Levels: $0.000010 – $0.000012 (short-term breakout zone), $0.000014 – $0.000020 (mid-range resistance).
- Bullish Breakout Target: Above $0.000042, leading toward $0.000060.
If PEPE sustains bullish momentum and successfully reclaims critical resistance levels, the token has the potential to reach its upper target of $0.000060 by 2025. However, if selling pressure dominates, a lower consolidation phase near $0.000014 – $0.000020 may be more realistic before any major breakout occurs.
Pepe (PEPE) Price Prediction for 2026
Pepe (PEPE) is expected to continue its upward trajectory in 2026, with prices ranging between $0.000035 and $0.000072, averaging around $0.000053. If PEPE successfully holds key support levels from 2025 and experiences increased adoption in the meme coin market, it could break through previous resistance. However, market volatility could lead to fluctuations, and a failure to sustain momentum might keep prices in the mid-$0.000040 range before another rally.
Pepe (PEPE) Price Prediction for 2027
By 2027, PEPE could see further growth, trading between $0.000045 and $0.000083, with an average price of $0.000063. The rise in DeFi integrations and potential NFT partnerships could fuel interest in the token, driving it toward the upper limit. If PEPE can consolidate above $0.000060 and maintain buying pressure, it could challenge the $0.000080 level, marking new highs for meme coin investors.
Pepe (PEPE) Price Prediction for 2028
In 2028, the expected range for PEPE is $0.000067 to $0.000102, averaging $0.000085. This year could see increased institutional acceptance of meme tokens, pushing PEPE into the mainstream crypto narrative. If the overall market is in a bullish phase, PEPE might see an explosive rally past $0.000100, but corrections will likely occur before stabilizing at key support levels.
Pepe (PEPE) Price Prediction for 2029
As the crypto industry evolves, PEPE could experience moderate but steady growth in 2029, with a projected range of $0.000088 to $0.000115, averaging $0.000099. While gains may slow compared to previous years, PEPE’s increasing scarcity and growing holder base could maintain its position above $0.000090. However, long-term holders should be cautious of profit-taking that may cause temporary dips before further upward movements.
Pepe (PEPE) Price Prediction for 2030
By 2030, PEPE is forecasted to reach between $0.000105 and $0.000140, with an average trading price of $0.000122. As meme coins solidify their position in digital assets, PEPE’s ecosystem might expand through gaming, metaverse projects, or token utility improvements. If the market remains strong and PEPE maintains its relevance, a long-term rally above $0.000130 could be possible, cementing it as a major player in the meme token space.
FAQs
PEPE is expected to trade between $0.000014 and $0.000060, with an average price of $0.000042.
Increased meme coin adoption, market sentiment, and potential integrations in DeFi and NFTs could fuel upward momentum.
The $0.000010 – $0.000012 range is the primary resistance zone before a move toward $0.000014 – $0.000020.
While PEPE could see significant gains, breaking previous highs depends on broader market conditions and investor sentiment.
Strong support is expected near $0.000007500 – $0.000007700, with critical downside levels around $0.000006500 – $0.000007000.
If selling pressure dominates, PEPE could retest $0.000007000 – $0.000007500 before stabilizing.
The price nearing the lower Bollinger Band suggests a potential bounce, but failure to reclaim the middle band could signal continued weakness.
A bullish MACD crossover could confirm upward momentum, but failure to break resistance might extend consolidation.
RSI below 40 indicates weak momentum, but a rise above 50-55 could confirm renewed bullish strength.
If PEPE maintains its community-driven growth and expands its use cases, it could remain a valuable asset in the meme coin space.
Disclaimer: The information presented in this article is for informational and educational purposes only. The article does not constitute financial advice or advice of any kind. Coin Edition is not responsible for any losses incurred as a result of the utilization of content, products, or services mentioned. Readers are advised to exercise caution before taking any action related to the company.


