
Solana (SOL) Rebounds 12% But Selling Pressure Remains

Solana’s price is slipping as technical indicators show deepening bearish momentum. With support levels in sight, here’s what could come next.
Solana (SOL) has recovered over 12% today after Trump announced a 90-day pause on tariffs. Despite the significant recovery, technical indicators continue flashing bearish warnings. Key indicators like the RSI, BBTrend, and EMA lines all point to weakening momentum and a lack of buyer conviction. While oversold conditions have started to stabilize, the broader structure still leans slightly in favor of sellers.
Solana RSI Shows The Lack Of Conviction Among Buyers
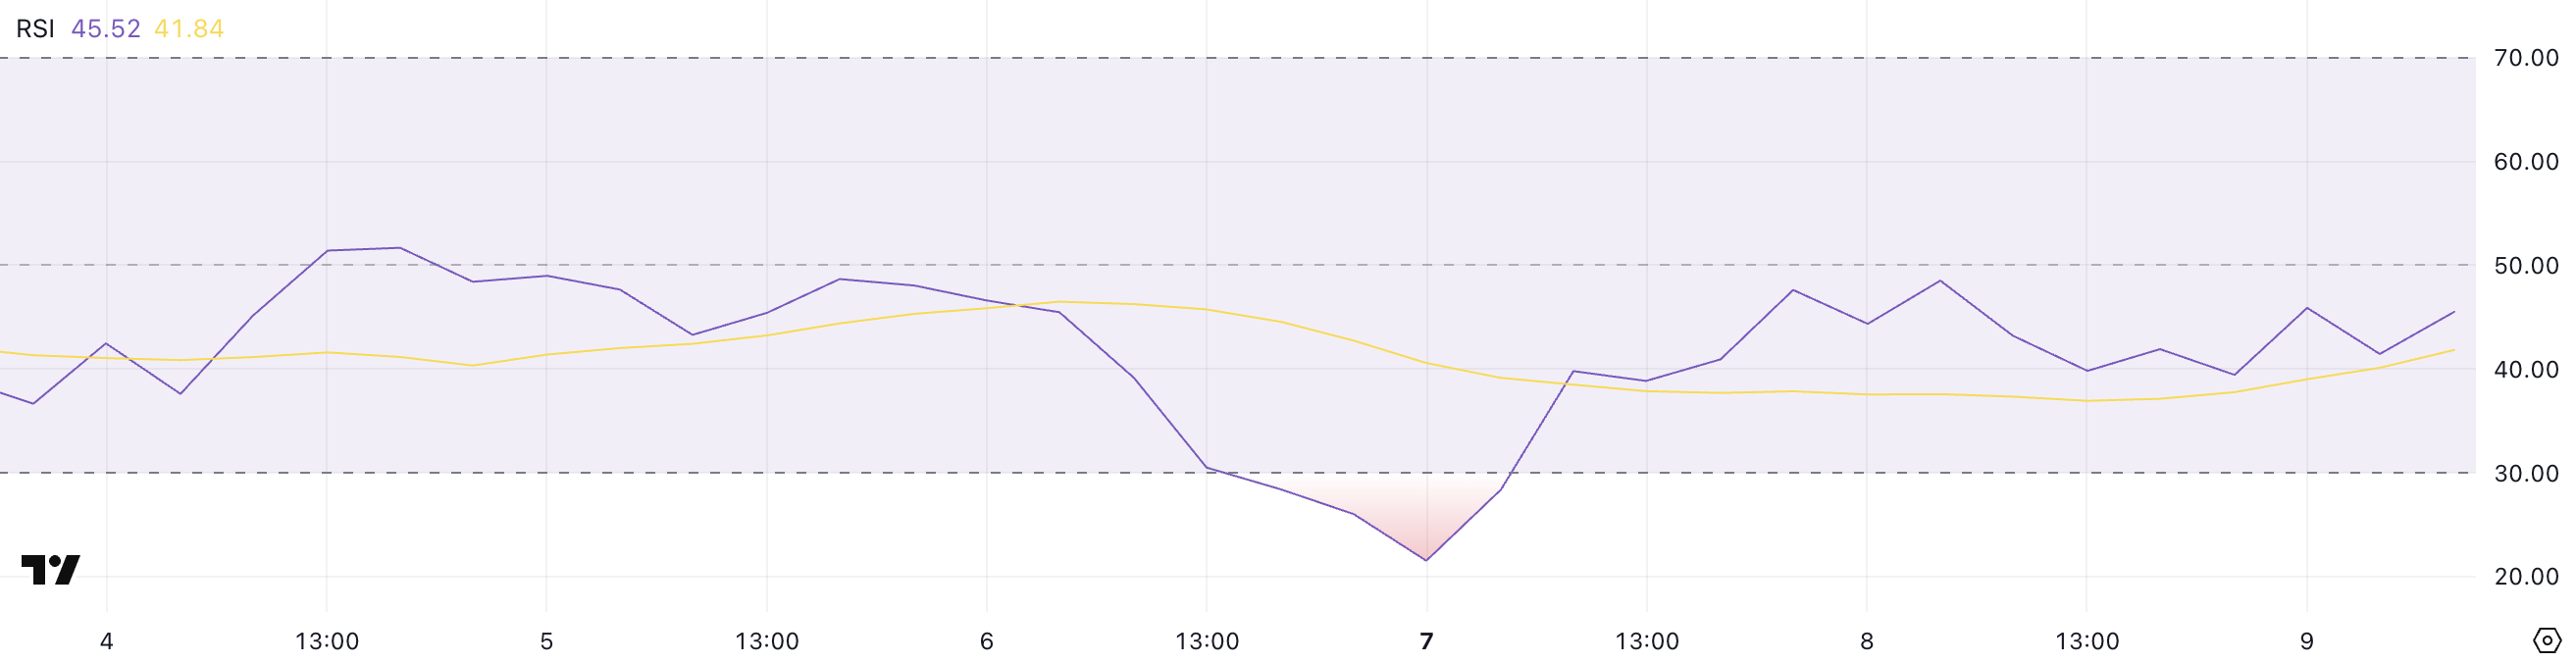
Solana’s Relative Strength Index (RSI) is currently sitting at 45.52, hovering in neutral territory but remaining below the midline of 50 for nearly two days.
This comes after the RSI briefly dipped to an oversold level of 21.53 two days ago, indicating that sellers had briefly dominated before demand began to stabilize.
The RSI’s slow climb back toward neutral suggests that while extreme selling pressure has eased, bullish momentum has not yet taken control.
 SOL RSI. Source:
TradingView.
SOL RSI. Source:
TradingView.
The RSI is a momentum oscillator that measures the speed and magnitude of recent price movements. It typically ranges from 0 to 100.
Readings above 70 are generally interpreted as overbought, signaling the potential for a pullback, while readings below 30 suggest oversold conditions and potential for a rebound.
Solana’s RSI at 45.52 indicates that the asset is in a recovery phase but lacks conviction. If the RSI fails to cross above 50 soon, it could imply continued hesitation among buyers and the potential for sideways price action or even another leg lower.
SOL BBTrend Has Reached Its Lowest Levels In Almost A Month
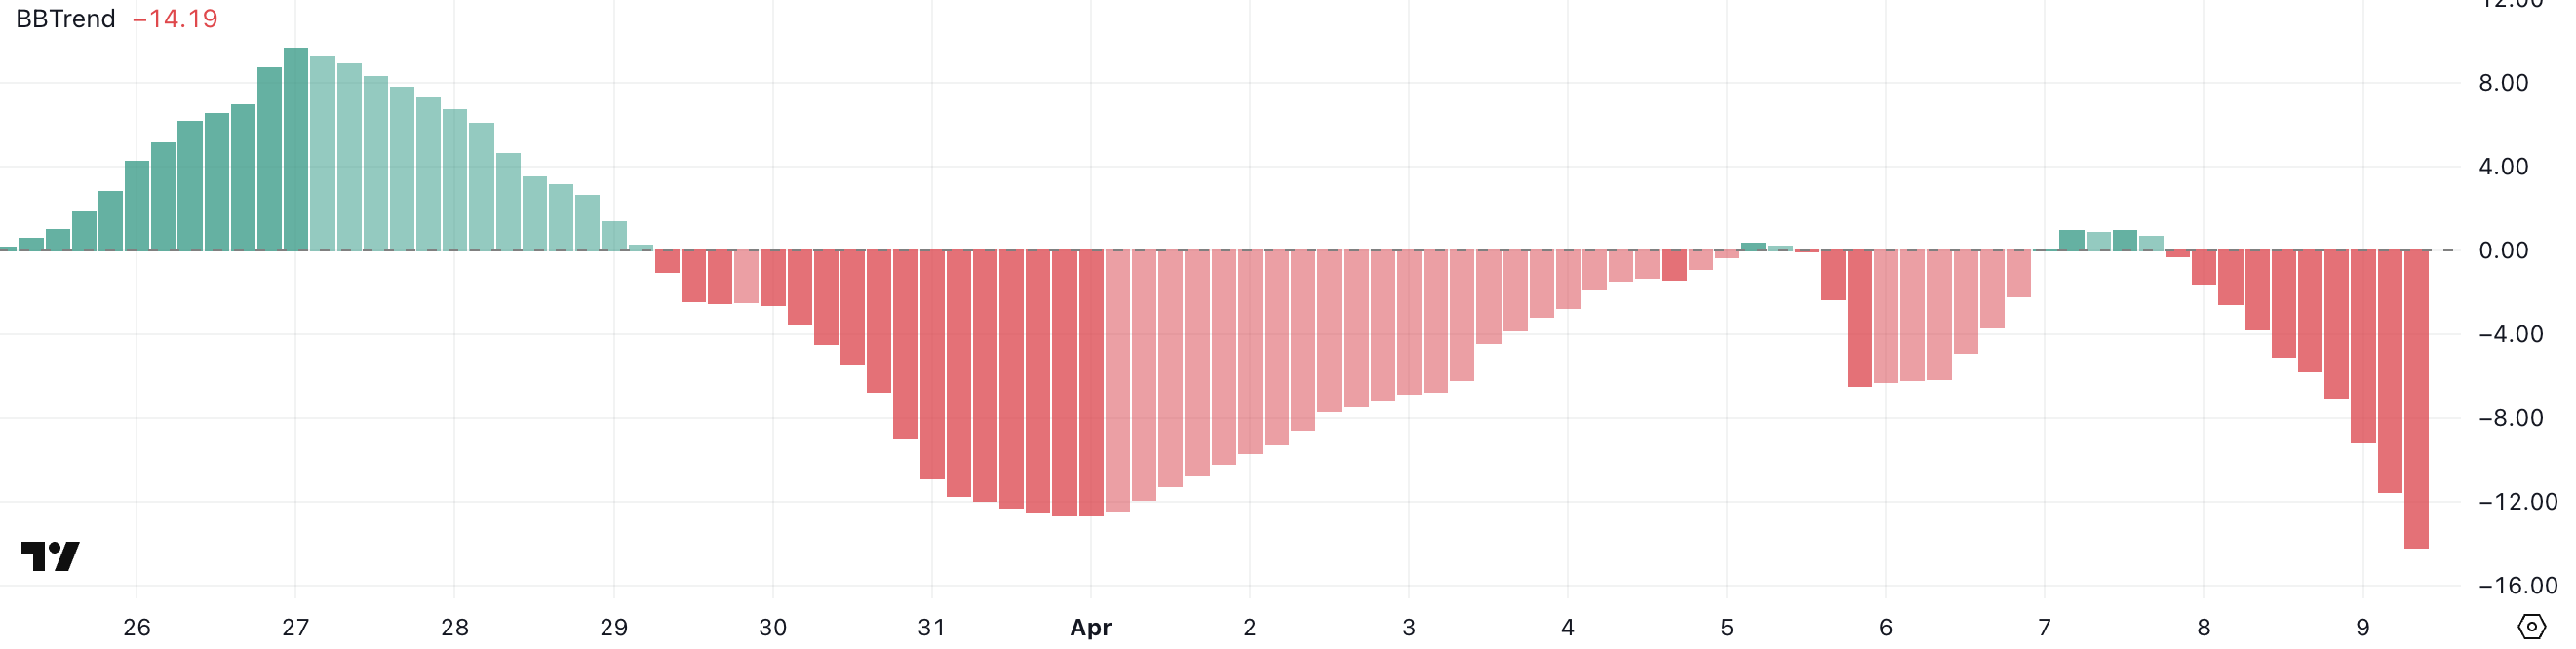
Solana’s BBTrend indicator is currently at -14.19, having turned negative since yesterday, and is at its lowest level since March 13—nearly a month ago.
This shift into deeper negative territory suggests that bearish momentum is building once again after a period of relative stability.
The return to these levels may indicate growing downside pressure, especially if follow-through selling continues in the short term.
 SOL BBTrend. Source:
TradingView.
SOL BBTrend. Source:
TradingView.
The BBTrend (Bollinger Band Trend) is a volatility-based indicator that measures the strength and direction of a price trend using the distance between price and Bollinger Bands.
Positive BBTrend values generally reflect bullish momentum, while negative values signal bearish momentum. The deeper the reading into negative territory, the stronger the downward pressure is considered to be.
Solana’s BBTrend is now at -14.19, implying an intensifying bearish phase, which could mean further price declines unless sentiment or volume shifts quickly in favor of buyers.
Will Solana Dip Below $100 Again In April?
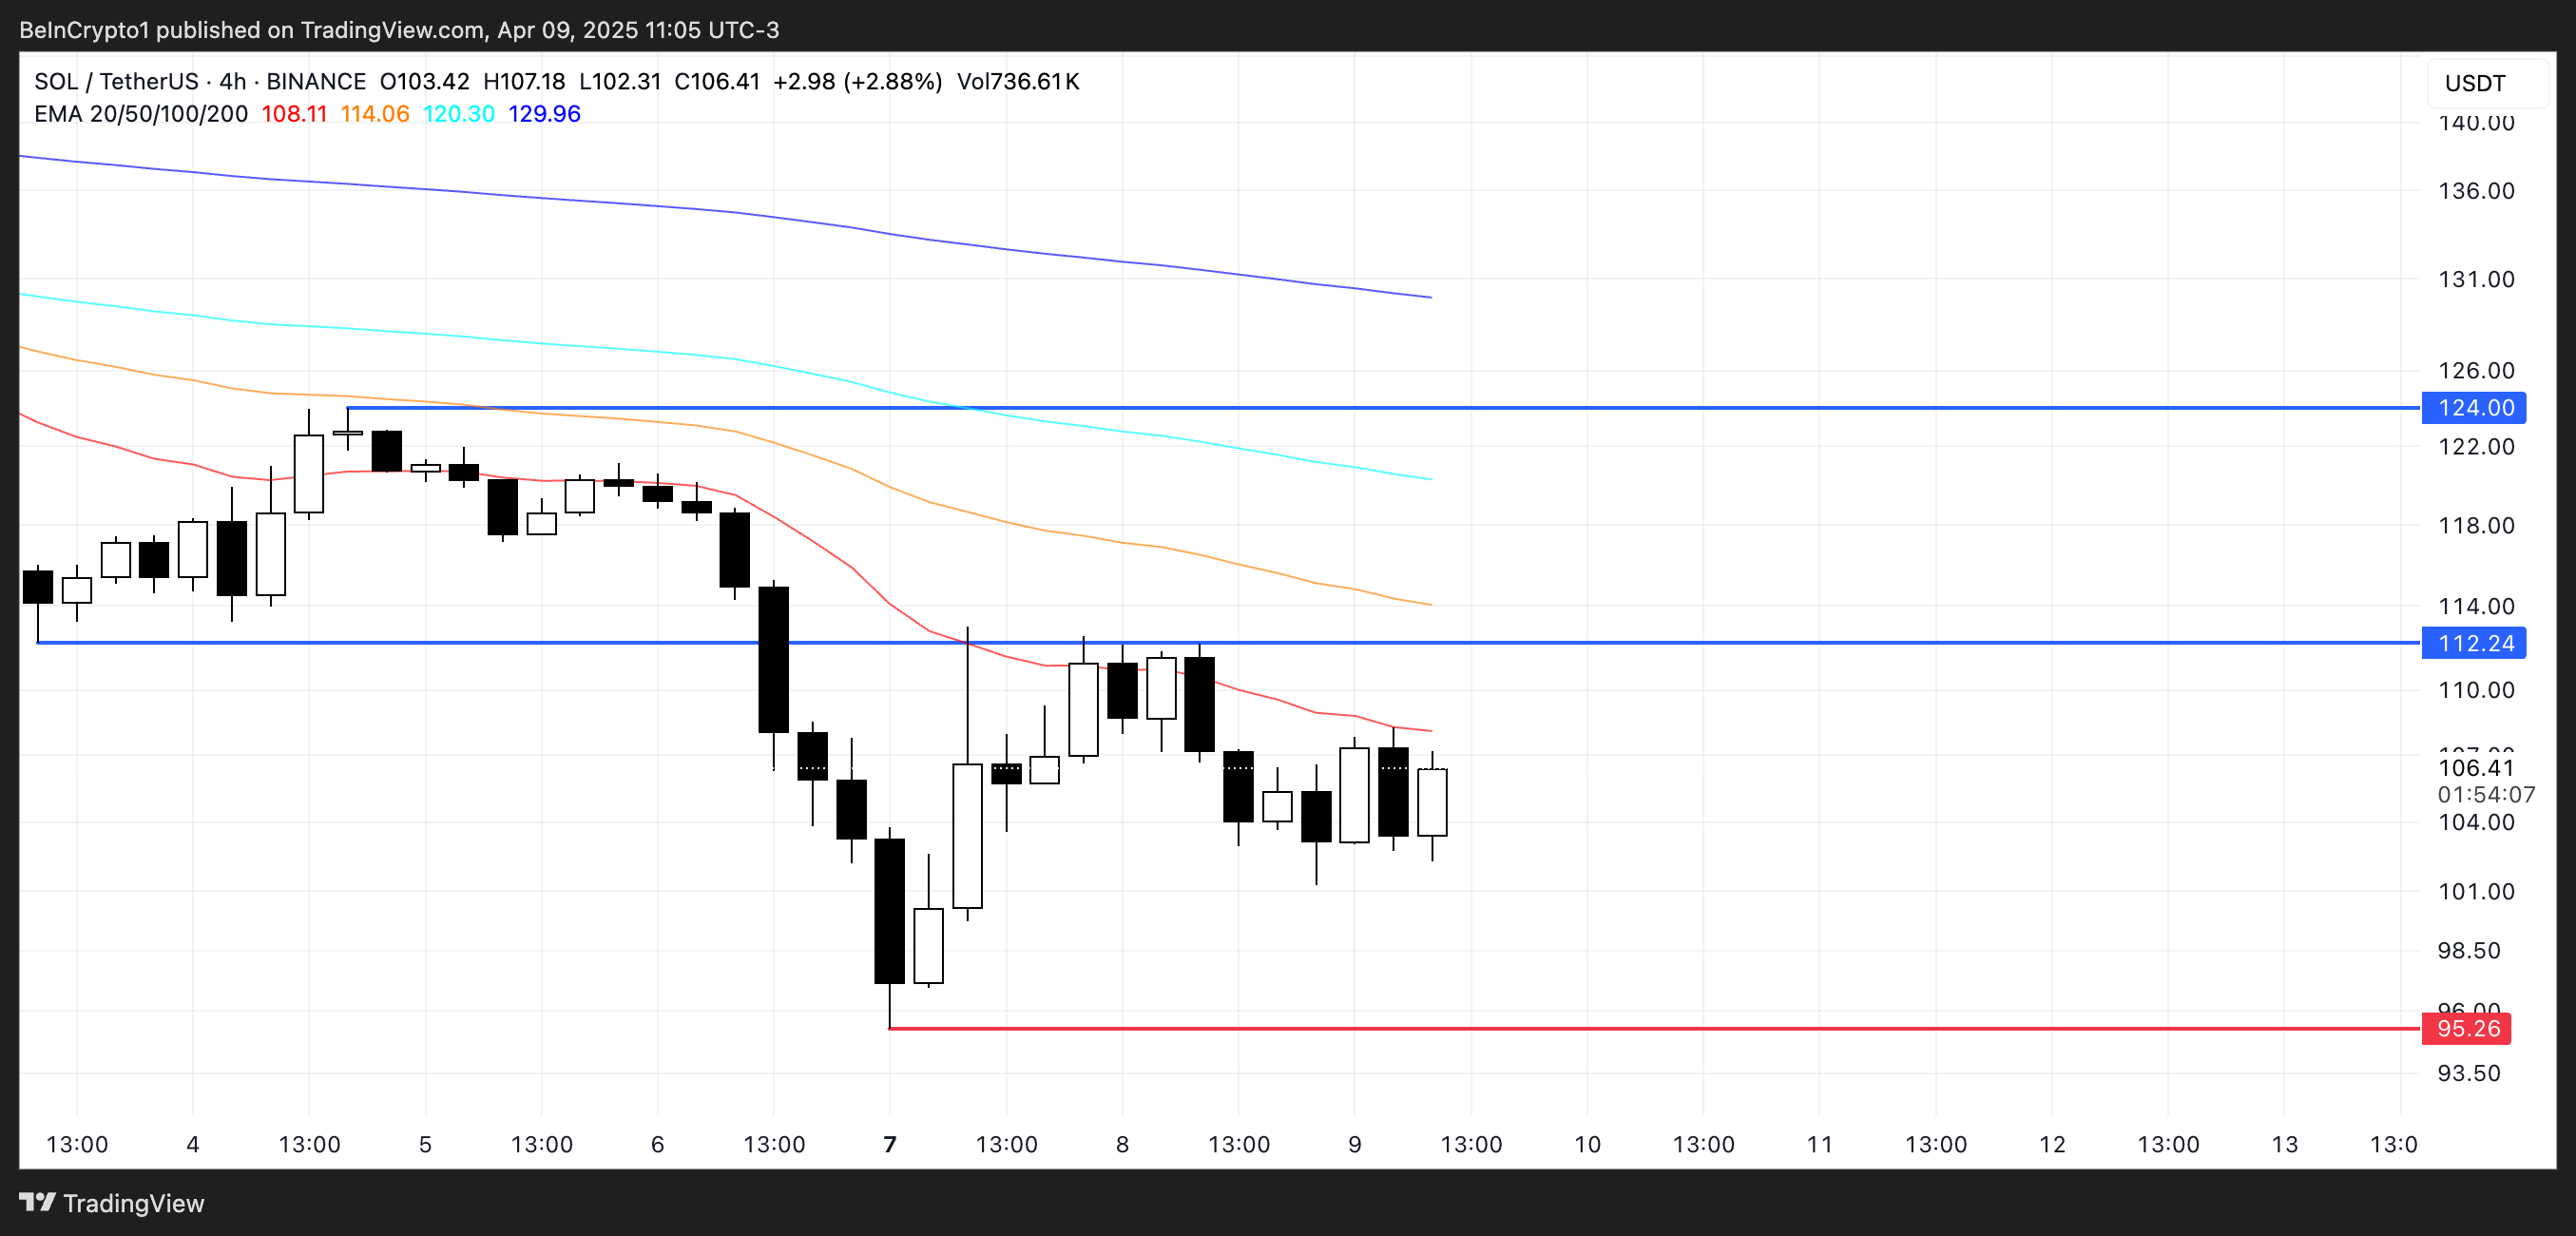
Solana’s EMA setup continues to reflect a strong bearish structure, with short-term moving averages remaining well below long-term ones.
This alignment confirms that downward momentum is still in control, keeping sellers in a dominant position.
 SOL Price Analysis. Source:
TradingView.
SOL Price Analysis. Source:
TradingView.
However, if Solana price manages to sustain the current strength and buying interest, it could test resistance at $120. A break above that level may open the path toward the next target at $134.
On the downside, if the current bearish trend persists, Solana could revisit support near $95, a level that has previously acted as a short-term floor.
Losing this level would be technically significant, potentially pushing SOL below $90—territory not seen since January 2024.
Disclaimer: The content of this article solely reflects the author's opinion and does not represent the platform in any capacity. This article is not intended to serve as a reference for making investment decisions.
You may also like
Review Article - ROI - For Trump's Treasury, the "tail" of the auction is the toughest part: McKeever
Repeated, no changes to the main text. By Jamie McGeever Reuters, Orlando, Florida, October 6 - U.S. Treasury auctions are supposed to be dull, predictable, and lacking in news value. But these are unusual times, and the Trump administration now faces the risk of weak government bond sales making headlines. The U.S. Treasury plans to issue nearly $120 billion in bonds this week—the first auction of bonds other than short-term Treasury bills in two weeks: $58 billion in three-year notes on Tuesday, $39 billion in ten-year notes on Wednesday, and $22 billion in thirty-year bonds on Thursday. These auctions would ordinarily be inconsequential, but they're attracting increased attention due to the exceptionally weak auction results from September 22–24—particularly the five-year Treasury auction on September 23, which led to the largest jump in yields since April of last year. Since then, yields have not fallen back, and instead, have surged to multi-decade highs across most maturities. It's important to note that the possibility of a "failed" U.S. Treasury auction is nearly zero. The primary dealers—26 banks and institutions currently authorized by the New York Fed to act as Treasury market makers on Wall Street—are always involved. They essentially underwrite the sales, ensuring the smooth operation of the $30 trillion U.S. Treasury market, which is the most liquid in the world. This, in turn, keeps the entire global financial system running. Trillions of dollars of global debt, assets, and market derivatives are benchmarked off U.S. Treasuries. U.S. Treasuries also serve as collateral to "lubricate" the pipes of the U.S. and global financial systems—in repos, interbank lending, and financing. In short, as long as U.S. Treasuries remain the backbone of the global financial system, there will always be buyers in Treasury auctions. The perpetual question is the price at which these bonds ultimately clear. With borrowing costs in the secondary market now at their highest since the mid-2000s, it's reasonable to expect the Treasury will pay correspondingly high rates in the primary market. But as recent auction rounds have shown, there remains potential for negative surprises. “Too big for the market to digest?” The $70 billion five-year auction on September 23 was among the most concerning in recent years. Demand—as measured by bid-to-cover ratio—was the lowest in nine years. The Treasury sold these notes at a yield of 5.033%, more than 3 basis points above the market yield at the auction deadline. Three basis points might not sound like much, but for a five-year Treasury auction, that's highly unusual. This was the largest so-called "tail" since June 2022. JP Morgan analysts pointed out that the last time the five-year auction saw a three-basis-point tail was back in 2011—when the brewing debt ceiling crisis ultimately led to the U.S. credit rating being downgraded that August. Back to today, concerns over the U.S.'s bleak fiscal outlook have pushed up long-term borrowing costs. Consequently, markets widely expect the Trump administration to gradually shift the Treasury's massive funding needs toward the lower-cost, shorter end of the yield curve. That explains why the five-year auction two weeks ago caused such a stir. A three-basis-point tail is common in long-bond auctions, but rare for securities in the so-called "belly" of the curve. If the Treasury is forced to pay a higher premium to move these bonds, then Houston, we have a problem. Large auction tails can be caused by numerous factors, such as market volatility on the day of the auction or, more worryingly, underlying fundamental issues that could erode demand over time. It's usually difficult to distinguish between these dynamics, as they're not mutually exclusive. On the brighter side, this unease hasn't yet spread to the short end of the curve. At least, not for now. Three- and ten-year Treasury yields have risen by about 50 basis points from the last auction a month ago, hovering around 4.96% and 5.32% respectively. The 30-year yield is up about 35 basis points, to 5.65%. That should be high enough to attract strong demand and ensure smooth sales, right? Probably. But if we get a surprise, volatility and uncertainty could ripple across the entire market. Investors will be… watching developments like hawks. (The views expressed herein are those of the author, a Reuters columnist.) Enjoyed this column? Visit Reuters Open Interest, your essential new source for global financial commentary. Follow ROI on LinkedIn and X. You can also listen to the daily "Morning Bid" podcast on Apple, Spotify, or the Reuters app. Subscribe for seven-day-a-week in-depth analysis of market and financial news by Reuters journalists. US 5-year auction has biggest 'tail' since 2022 https://fingfx.thomsonreuters.com/gfx/mkt/dwpkmkzogpm/TAIL.png (For reader convenience, Reuters automatically translates its reports into several other languages. Automate
Will cancelling 20-year U.S. Treasury bonds backfire? BNP Paribas warns it could worsen market sell-off; maintains prediction of 30-year yield rising to 5.8%
BNP Paribas warns that U.S. Treasury Secretary Janet Yellen should resist calls to cancel the issuance of 20-year U.S. Treasury bonds, as this measure, seemingly aimed at lowering long-term financing costs, could have the opposite effect. Not only would it be difficult to continuously suppress Treasury yields, but it could also raise borrowing costs and weaken market liquidity.
Uncertainty Remains Over Fed Rate Hike Outlook; Daly Focuses on Inflation Shock Persistence, Bowman Advances Bank Regulatory Reforms
The Federal Reserve is simultaneously advancing significant adjustments in both monetary policy and banking supervision.

Overnight US Stocks | S&P 500 and Nasdaq Reach All-Time Highs, Storage Concept Stocks Plunge, SK Hynix (SKHY.US) Drops Over 6%
At the close, the Dow Jones Index rose by 253.32 points, or 0.49%, to 51,521.22 points; the S&P 500 Index increased by 45.03 points, or 0.58%, to 7,818.98 points; and the Nasdaq Composite Index gained 122.48 points, or 0.45%, to 27,599.79 points.
Crypto prices
More


