
Hedera (HBAR) Indicators Show Bullish Momentum and More Gains Ahead

Hedera leads the crypto pack with a 14% surge as key indicators flash bullish, but resistance and cloud structure may test the rally’s strength.
Hedera (HBAR) has recovered over 5% in the past week. Despite some corrections today, multiple technical indicators flash bullish signals, suggesting a potential shift in momentum.
The DMI shows buyers firmly in control, the Ichimoku Cloud has flipped bullish, and a golden cross appears close to forming on the EMA lines. With key resistance levels approaching, HBAR could be gearing up for an extended move—if the current momentum holds.
HBAR DMI Shows Buyers Are In Full Control
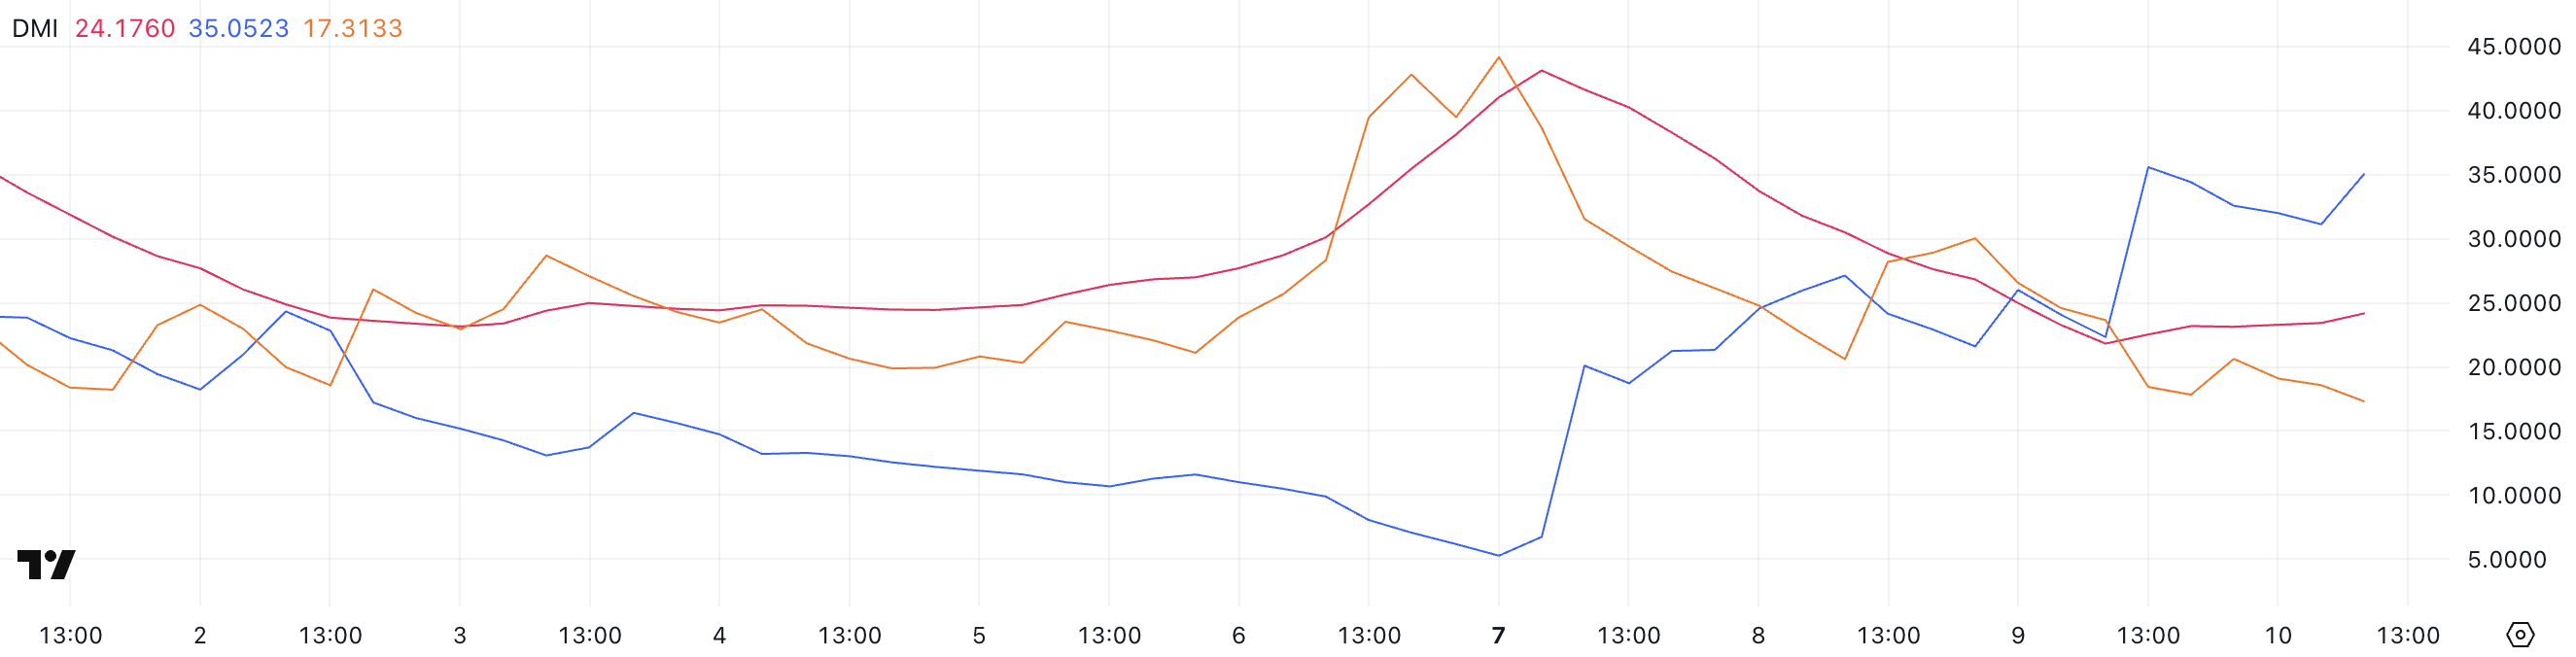
Hedera’s DMI chart is showing signs of strengthening trend momentum, with the ADX (Average Directional Index) rising to 24.17 from 21.82 just a day ago.
The ADX measures the strength of a trend regardless of its direction. Readings above 25 typically indicate a strong trend, while values between 20 and 25 suggest a trend may be developing.
With the ADX nearing that threshold, Hedera could be preparing for a more decisive move if momentum continues building.
 HBAR DMI. Source:
TradingView.
HBAR DMI. Source:
TradingView.
Looking at the directional indicators, the +DI has surged to 35.05 from 22.33, while the -DI has dropped to 17.31 from 23.65. This widening gap between the bullish and bearish pressure signals a strong shift in favor of buyers.
If this setup holds, it could indicate a developing uptrend for HBAR, especially if the ADX continues to climb above 25.
The combination of rising bullish momentum and weakening selling pressure is a positive technical signal, suggesting that Hedera may be gearing up for further upside in the short term.
Hedera Ichimoku Cloud Shows A Bullish Setup
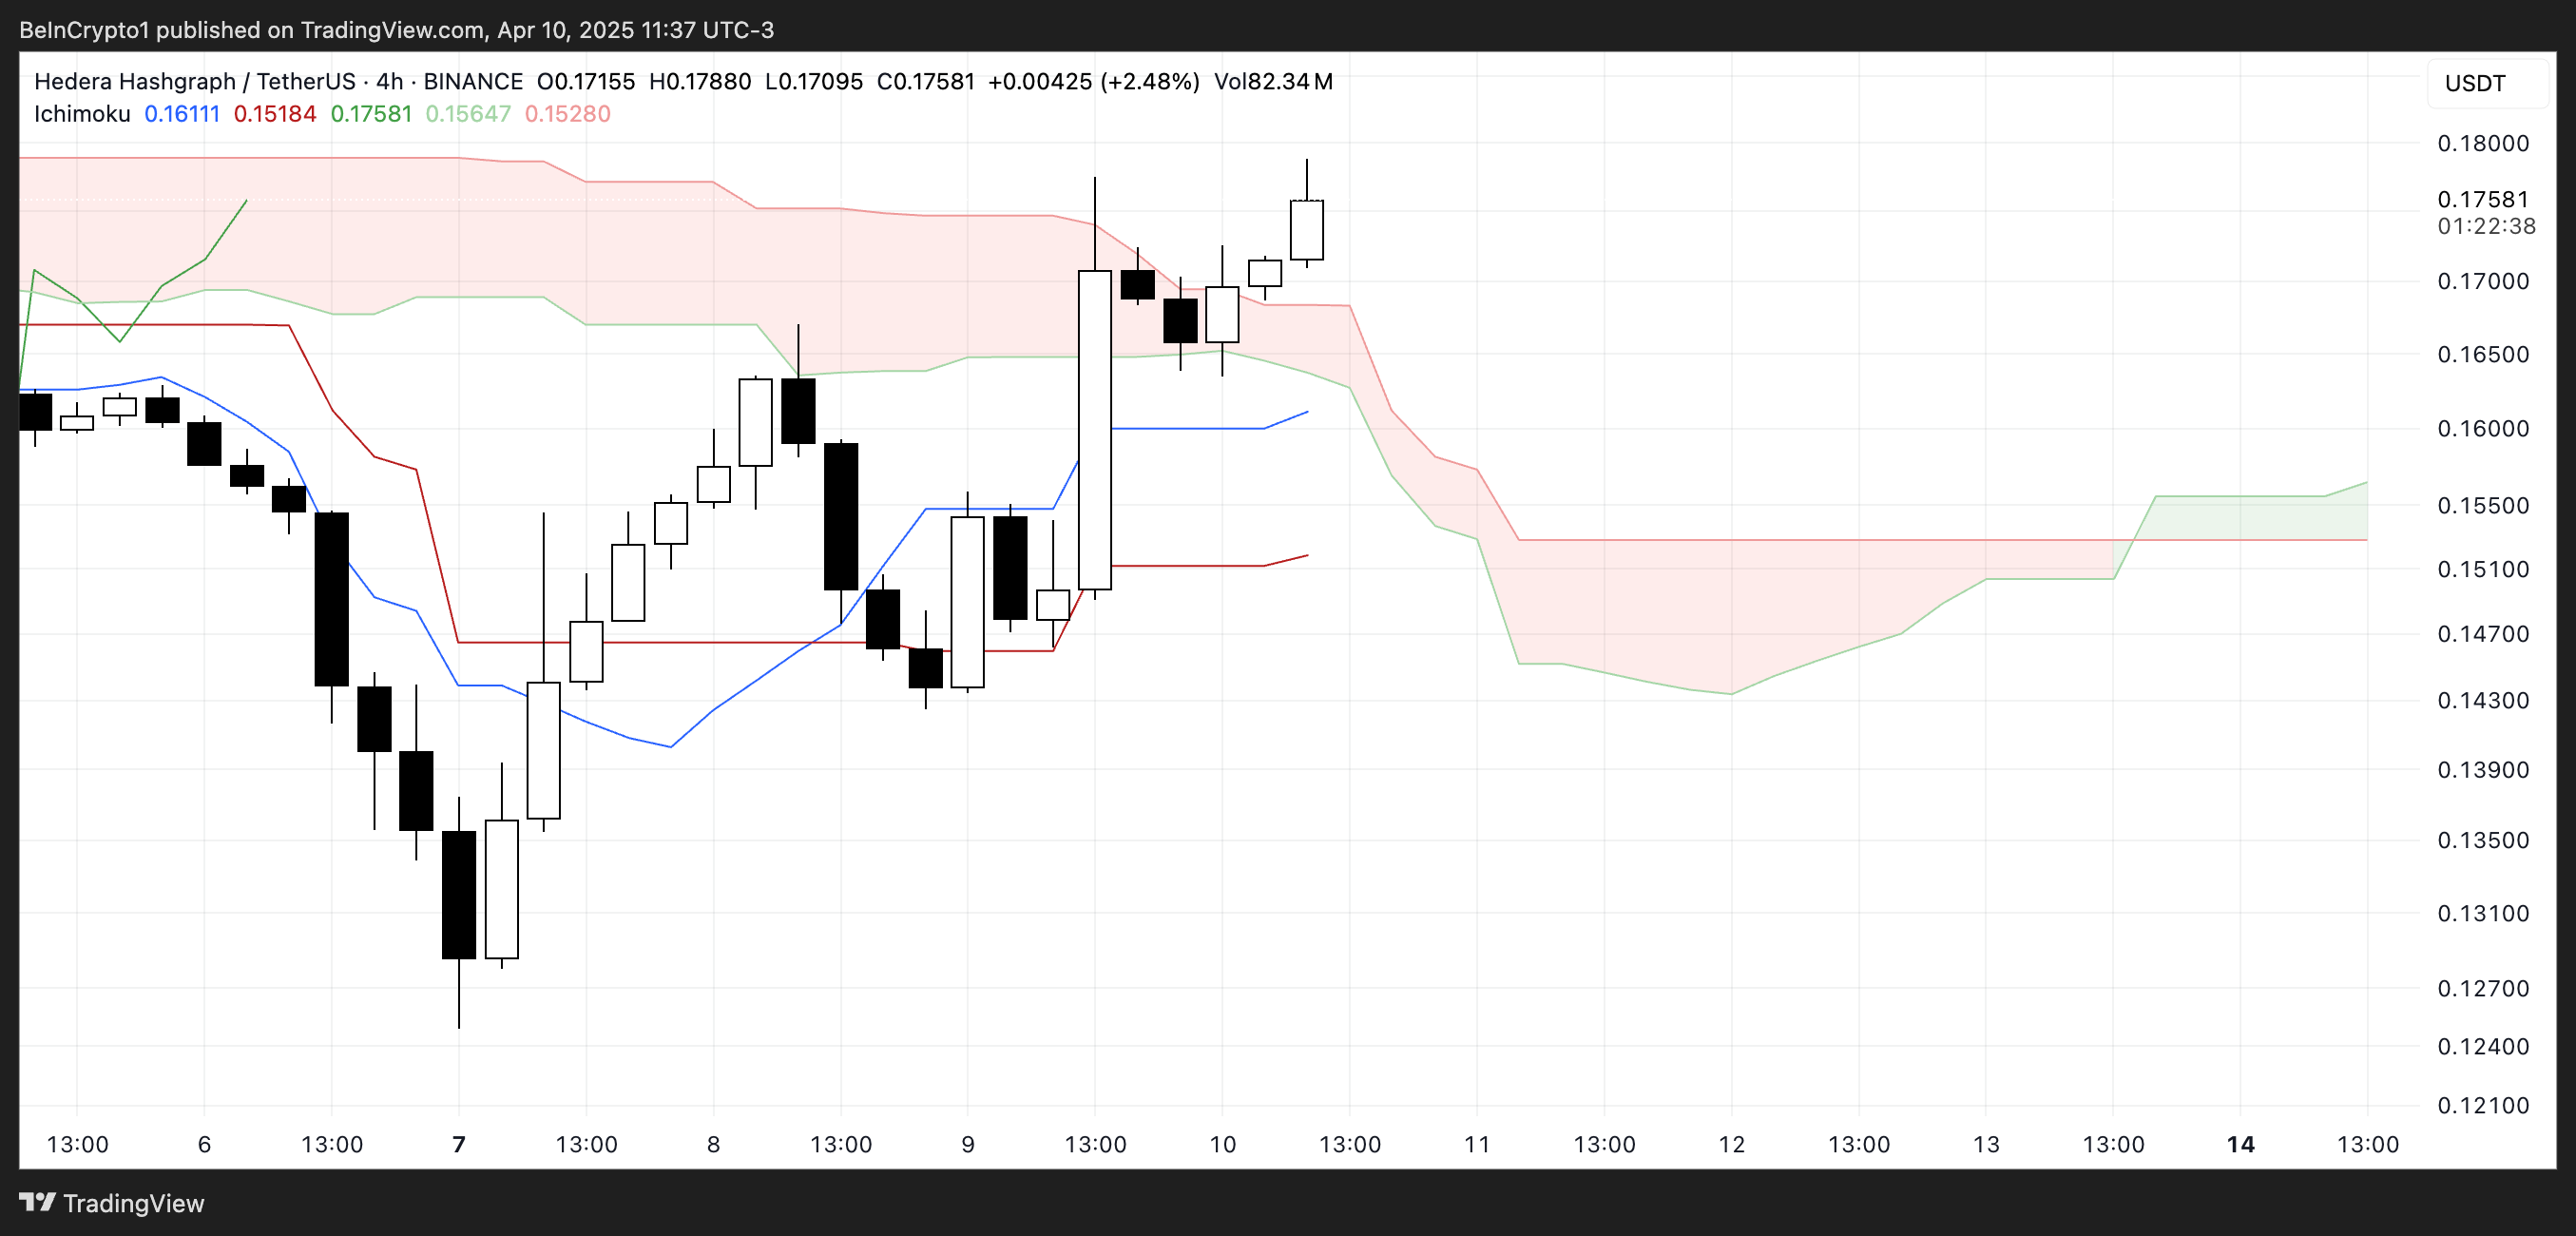
Hedera’s Ichimoku Cloud chart is flashing a bullish signal. After a strong move upward, price action broke above the red cloud (Kumo).
This breakout places the candles above both the Tenkan-sen (blue line) and the Kijun-sen (red line), which is generally seen as a sign of bullish momentum and short-term trend strength.
The cloud ahead has also started to thin, suggesting that resistance may be weakening. If momentum holds, further upside is more achievable.
 HBAR Ichimoku Cloud. Source:
TradingView.
HBAR Ichimoku Cloud. Source:
TradingView.
The Chikou Span (lagging green line) is now positioned above the price candles and the cloud, reinforcing the bullish bias. However, with the cloud still showing a mostly flat and narrow structure, the current trend doesn’t yet show strong continuation signals.
If the price remains above the cloud and the Tenkan-sen continues to lead above the Kijun-sen, Hedera could sustain this upward trajectory.
But traders should watch closely for any signs of a reversal back into or below the cloud, which would weaken the bullish setup.
Hedera Could Surge Soon If The Golden Cross Emerges
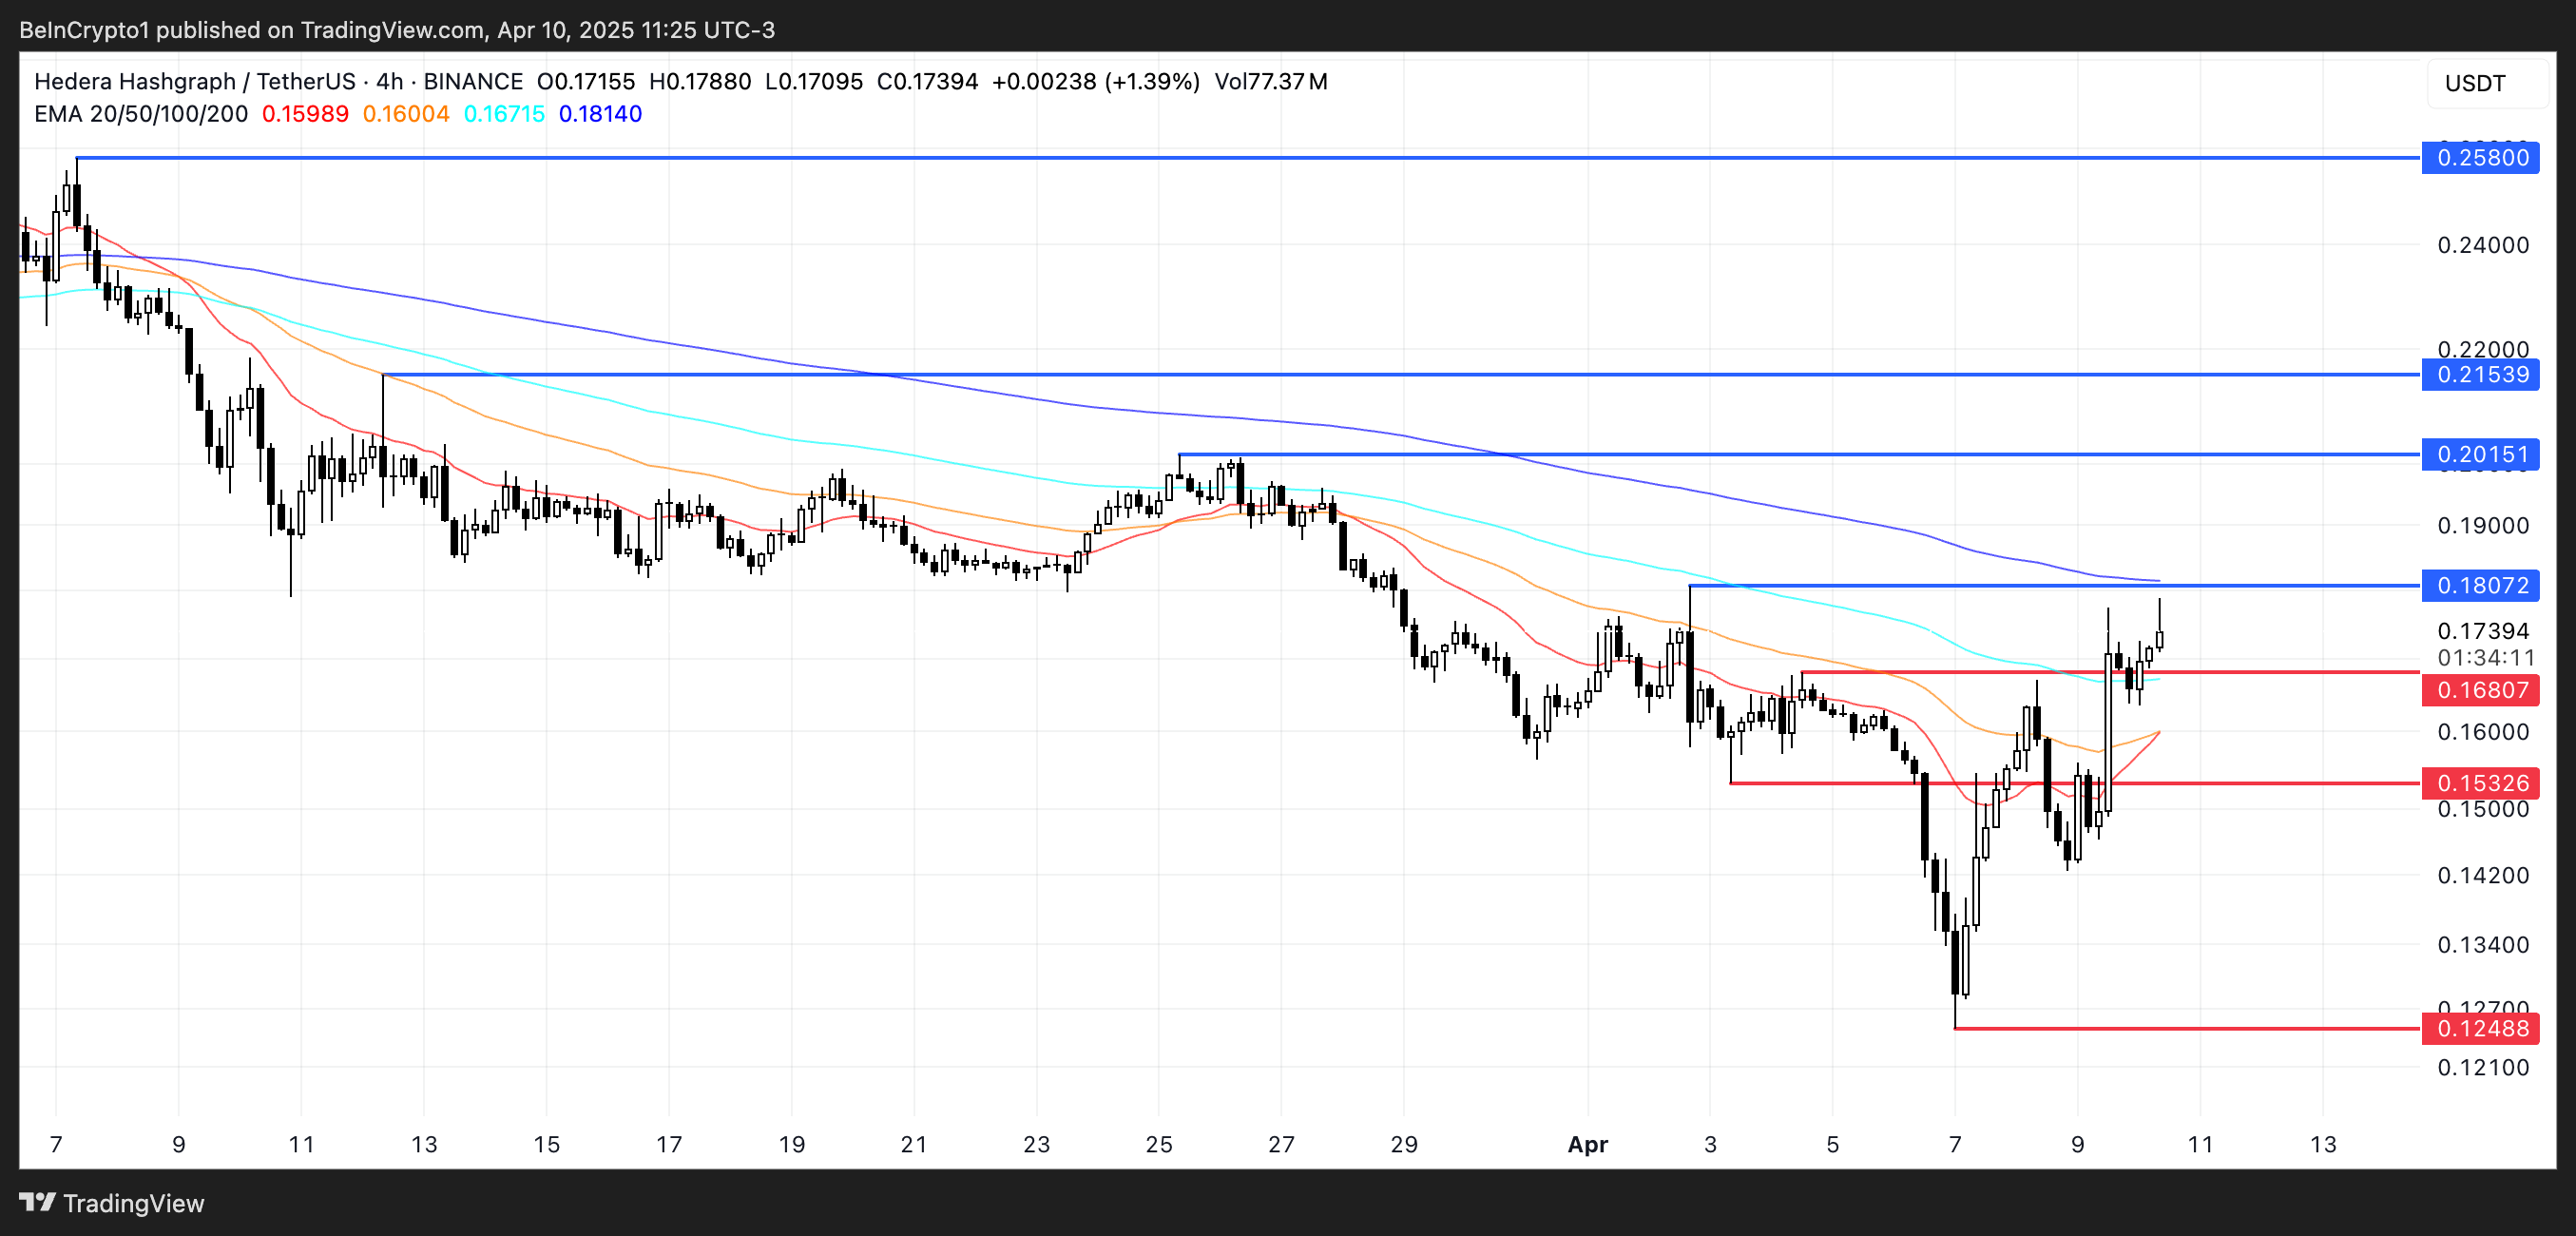
Hedera’s EMA lines are tightening, signaling a potential breakout. A golden cross—where short-term EMAs move above long-term ones—appears to be forming, which would typically indicate a bullish trend reversal.
If confirmed, this setup could push Hedera price toward resistance levels at $0.18 and $0.20, and if the momentum holds, even higher targets like $0.21 and $0.258 may come into play.
 HBAR price Analysis. Source:
TradingView.
HBAR price Analysis. Source:
TradingView.
However, this bullish scenario hinges on a successful break above the immediate resistance. If HBAR fails to clear the $0.18 level, it could trigger a pullback toward the support at $0.168.
Losing that support would likely expose Hedera to further downside. The next key levels are $0.153 and possibly below $0.13 if selling pressure intensifies.
Disclaimer: The content of this article solely reflects the author's opinion and does not represent the platform in any capacity. This article is not intended to serve as a reference for making investment decisions.
You may also like

Nvidia’s Record Run Signals Another AI Wave: 5 Cryptos Worth Buying Before the Breakout
Apple (AAPL.US) Teams Up with LG to Enter Smart Home Market: Accessories such as doorbells, thermostats, and cameras to feature LG branding
According to sources, Apple is set to expand its smart home device lineup, including doorbells, thermostats, and other accessories. These products will be developed through an unusual partnership between Apple and LG Electronics.
Review Article - ROI - For Trump's Treasury, the "tail" of the auction is the toughest part: McKeever
Repeated, no changes to the main text. By Jamie McGeever Reuters, Orlando, Florida, October 6 - U.S. Treasury auctions are supposed to be dull, predictable, and lacking in news value. But these are unusual times, and the Trump administration now faces the risk of weak government bond sales making headlines. The U.S. Treasury plans to issue nearly $120 billion in bonds this week—the first auction of bonds other than short-term Treasury bills in two weeks: $58 billion in three-year notes on Tuesday, $39 billion in ten-year notes on Wednesday, and $22 billion in thirty-year bonds on Thursday. These auctions would ordinarily be inconsequential, but they're attracting increased attention due to the exceptionally weak auction results from September 22–24—particularly the five-year Treasury auction on September 23, which led to the largest jump in yields since April of last year. Since then, yields have not fallen back, and instead, have surged to multi-decade highs across most maturities. It's important to note that the possibility of a "failed" U.S. Treasury auction is nearly zero. The primary dealers—26 banks and institutions currently authorized by the New York Fed to act as Treasury market makers on Wall Street—are always involved. They essentially underwrite the sales, ensuring the smooth operation of the $30 trillion U.S. Treasury market, which is the most liquid in the world. This, in turn, keeps the entire global financial system running. Trillions of dollars of global debt, assets, and market derivatives are benchmarked off U.S. Treasuries. U.S. Treasuries also serve as collateral to "lubricate" the pipes of the U.S. and global financial systems—in repos, interbank lending, and financing. In short, as long as U.S. Treasuries remain the backbone of the global financial system, there will always be buyers in Treasury auctions. The perpetual question is the price at which these bonds ultimately clear. With borrowing costs in the secondary market now at their highest since the mid-2000s, it's reasonable to expect the Treasury will pay correspondingly high rates in the primary market. But as recent auction rounds have shown, there remains potential for negative surprises. “Too big for the market to digest?” The $70 billion five-year auction on September 23 was among the most concerning in recent years. Demand—as measured by bid-to-cover ratio—was the lowest in nine years. The Treasury sold these notes at a yield of 5.033%, more than 3 basis points above the market yield at the auction deadline. Three basis points might not sound like much, but for a five-year Treasury auction, that's highly unusual. This was the largest so-called "tail" since June 2022. JP Morgan analysts pointed out that the last time the five-year auction saw a three-basis-point tail was back in 2011—when the brewing debt ceiling crisis ultimately led to the U.S. credit rating being downgraded that August. Back to today, concerns over the U.S.'s bleak fiscal outlook have pushed up long-term borrowing costs. Consequently, markets widely expect the Trump administration to gradually shift the Treasury's massive funding needs toward the lower-cost, shorter end of the yield curve. That explains why the five-year auction two weeks ago caused such a stir. A three-basis-point tail is common in long-bond auctions, but rare for securities in the so-called "belly" of the curve. If the Treasury is forced to pay a higher premium to move these bonds, then Houston, we have a problem. Large auction tails can be caused by numerous factors, such as market volatility on the day of the auction or, more worryingly, underlying fundamental issues that could erode demand over time. It's usually difficult to distinguish between these dynamics, as they're not mutually exclusive. On the brighter side, this unease hasn't yet spread to the short end of the curve. At least, not for now. Three- and ten-year Treasury yields have risen by about 50 basis points from the last auction a month ago, hovering around 4.96% and 5.32% respectively. The 30-year yield is up about 35 basis points, to 5.65%. That should be high enough to attract strong demand and ensure smooth sales, right? Probably. But if we get a surprise, volatility and uncertainty could ripple across the entire market. Investors will be… watching developments like hawks. (The views expressed herein are those of the author, a Reuters columnist.) Enjoyed this column? Visit Reuters Open Interest, your essential new source for global financial commentary. Follow ROI on LinkedIn and X. You can also listen to the daily "Morning Bid" podcast on Apple, Spotify, or the Reuters app. Subscribe for seven-day-a-week in-depth analysis of market and financial news by Reuters journalists. US 5-year auction has biggest 'tail' since 2022 https://fingfx.thomsonreuters.com/gfx/mkt/dwpkmkzogpm/TAIL.png (For reader convenience, Reuters automatically translates its reports into several other languages. Automate
Crypto prices
More


