

Official Trump meme coin has been trending higher recently, gaining 6.69% in a week.
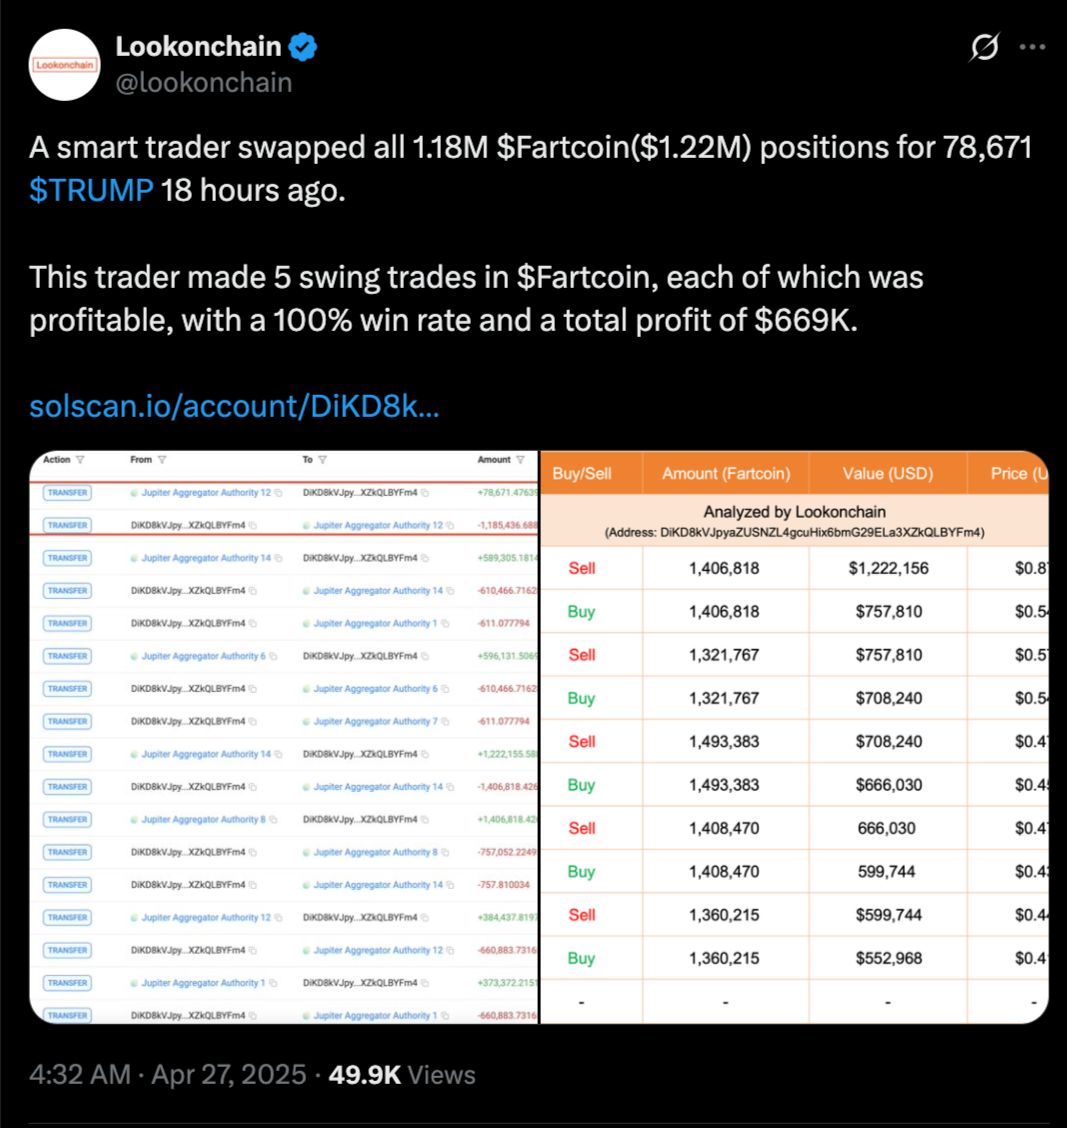
After crashing for most part of April, TRUMP coin saw significant whale activity recently. A smart trader traded their 1.18 million Fartcoin holdings, valued at roughly $1.22 million, for 78,671 $TRUMP tokens.
 Snap | Source: Lookonchain on X
The whale’s historical data states that once they successfully swung traded $Fartcoin, they were 100% successful with every five trades, giving them a positive return. During this period, they have profited a total of $669,000. The market participants view such a heavy allocation to TRUMP, given such a strong background in timing exits and entries, as a bullish signal.
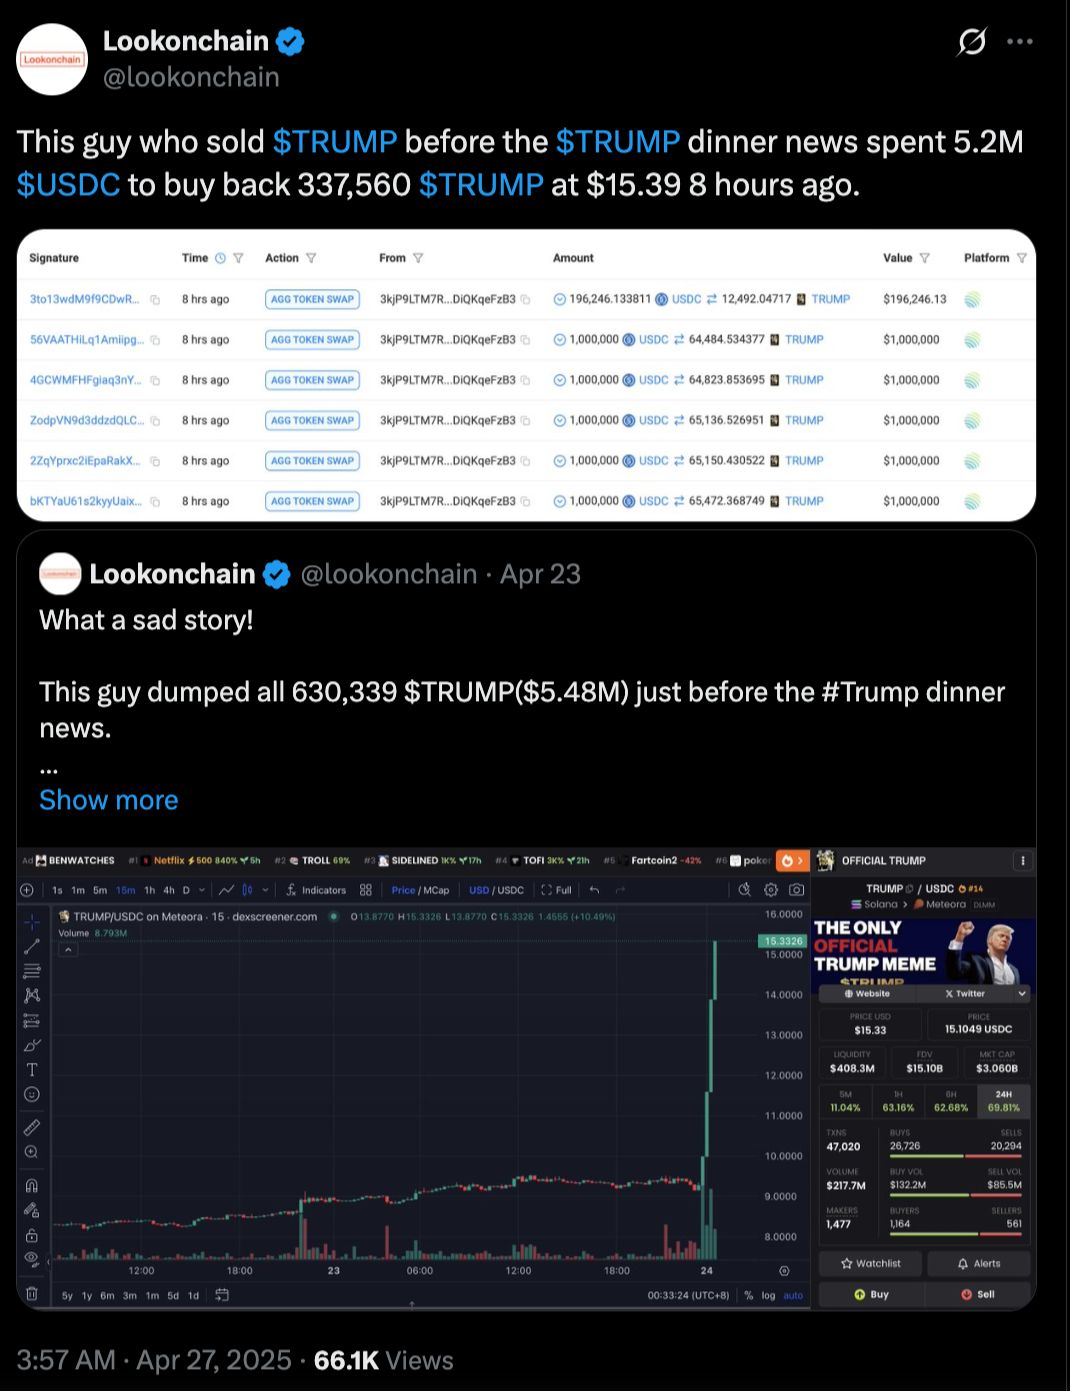
Another whale, who had previously pushed out their $TRUMP position before the well-documented $TRUMP dinner news, has recently returned for a significant amount. The trader used $5.2m to get 337,560 $TRUMP tokens. This purchase comes amid a price dip, underscoring growing confidence.
 Snap | Source: Lookonchain on X
TRUMP Meme Coin Price Gains Through The Week
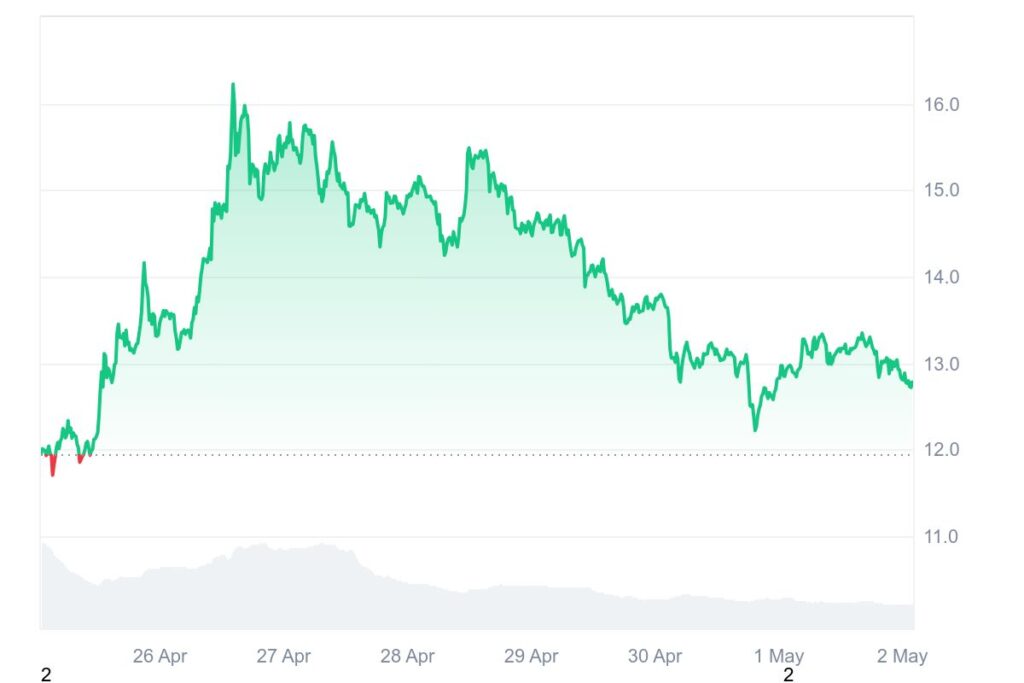
TRUMP meme coin was trading at $13 at the time of this writing after reaching a high of 13.40 earlier today. It gained by 3.31% in a day. During this period, its market capitalization gained by 3.31% to reach $ 2.26 billion.
TRUMP meme coin 24-hour trading volume dropped in the last 24 hours by 16.76% and was at 888.18 million. The TRUMP standing data has lots of volatility. over the week, prices swung between a high near $15 to a low near $12.
It started with a peak, a form of early morning peak, and then became steadily lower, the formation of lower lows and lower highs being bearish. There were earlier indicators of a recovery as buyers led the charge to defend the $14.30–$14.40 support range.
 TRUMP Meme Coin Weekly Chart | Source: CMC
TRUMP Coin Currently in an Up-trend, Future Looks Positive
On 4-hour charts, TRUMP meme coin has taken off after a strong run through recent sessions. Currently, the TRUMP/USDT pair trades at $12.77 and is down by 1.61% in the last 24 hours.
As technical indicators show continued momentum, the token attracted bullish sentiment. The following sessions will show if TRUMP can continue to rally or is headed for near-term buyer resistance.
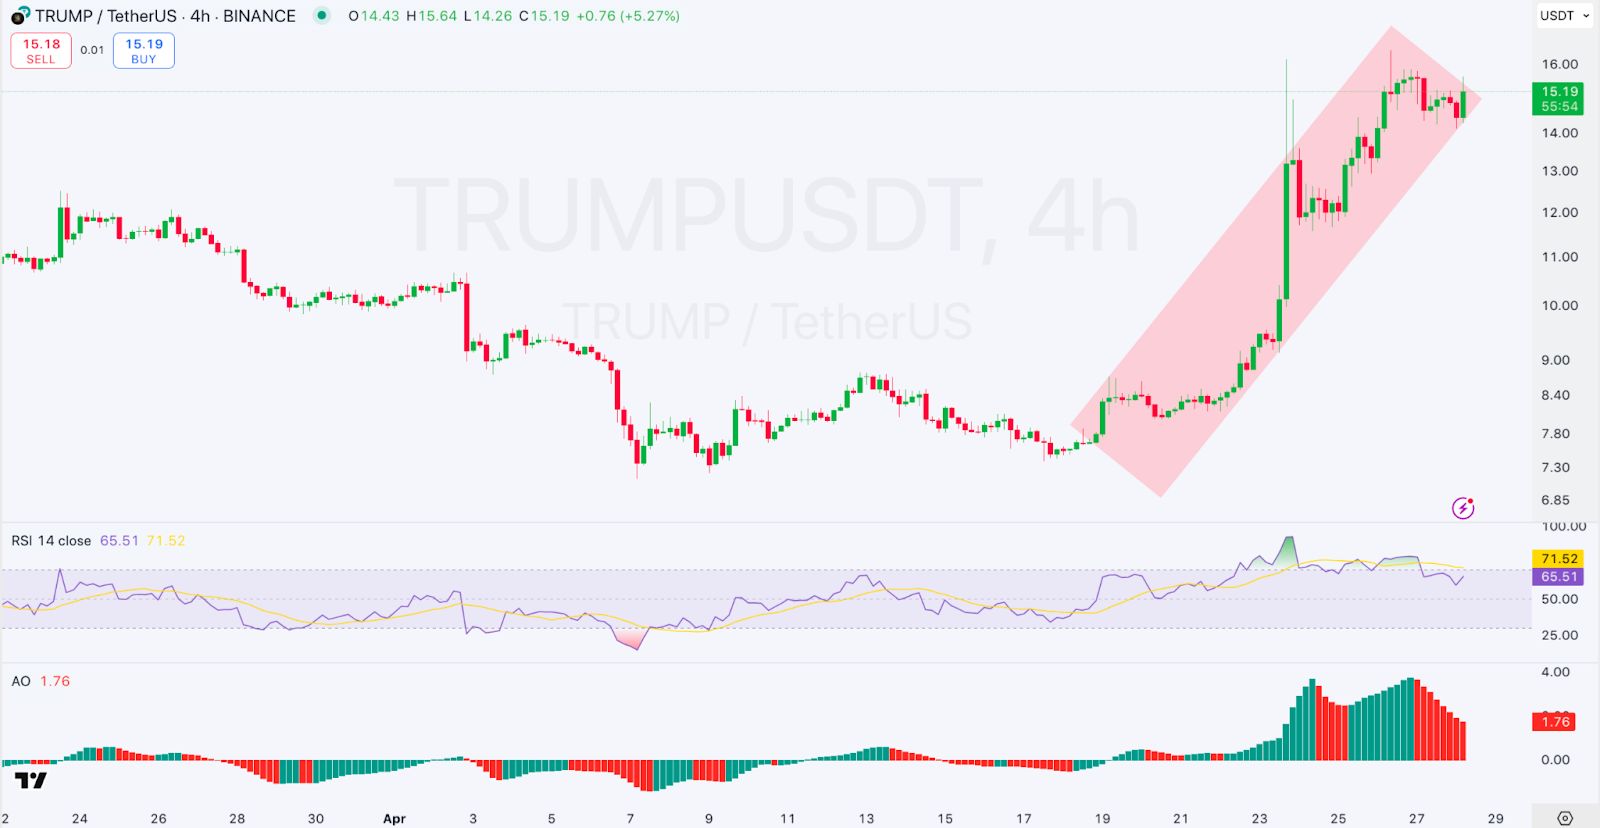
TRUMP’s 4-hr chart price action is relatively straightforward and consistent regarding an uptrend in a rising channel pattern. The token started its rally from the $8.50 mark range and has been consolidating within higher highs and lows.
Fresh buying is reinforcing the bullish structure following every slight pullback. The price initially tested the band channel briefly, but it has since returned to struggle, a behavior we often observe whilst traders take profits after fast moves.
The path of least resistance remains to the upside until TRUMP meme coin closes above the lower support line at about $14.00.
 4-hour TRUMP/USDT Chart | Source: TradingView
It is also valuable to know the strength of TRUMP meme coin’s current trend with the help of the Relative Strength Index (RSI). When the CFA was written, the RSI was at 65.51, in which the asset is still in bullish territory, but is no longer extremely overbought.
The rally was earlier, in which the RSI crossed 70 and indicated an overbought condition frequently witnessed before a minor correction or consolidation.
TRUMP has aged (digesting) its gain healthily into 65 without dipping below 50. Buyers should retain market control in RSI if it remains in the neutral zone.
The Awesome Oscillator (AO) also confirms the momentum as it stays above the zero line. A slight reduction in the size of the green bars has not been able to contain the positive momentum on the AO, though.
A bit of a momentum loss could indicate a cooling-down period, but it is not a clear indication of a bearish reversal. As long as the AO remains above zero, the thesis shows that TRUMP meme coin is still on an uptrend. If the oscillator rises again, it will strengthen the buyer’s hand. From another perspective, the move below zero indicates a deeper pullback.


