
Three Key Scenarios for Bitcoin Price in 2025 – Could BTC Hit $175,000?

Bitcoin may face three potential trend scenarios in the future, with the most optimistic one forecasting a surge to $150,000 to $175,000 within the next 12 months.
This prediction is supported by factors such as a strong influx of institutional capital and positive investor sentiment following the Trump administration’s plans to establish a national Bitcoin reserve.
Positive Forecasts from Experts and Market Signals
Bitcoin (BTC) is showing promising prospects as numerous positive signals from the market and expert predictions emerge in early May 2025. In an analysis by AxelAdlerJr, as of today, on-chain momentum is in the “starting” phase of a bull run.
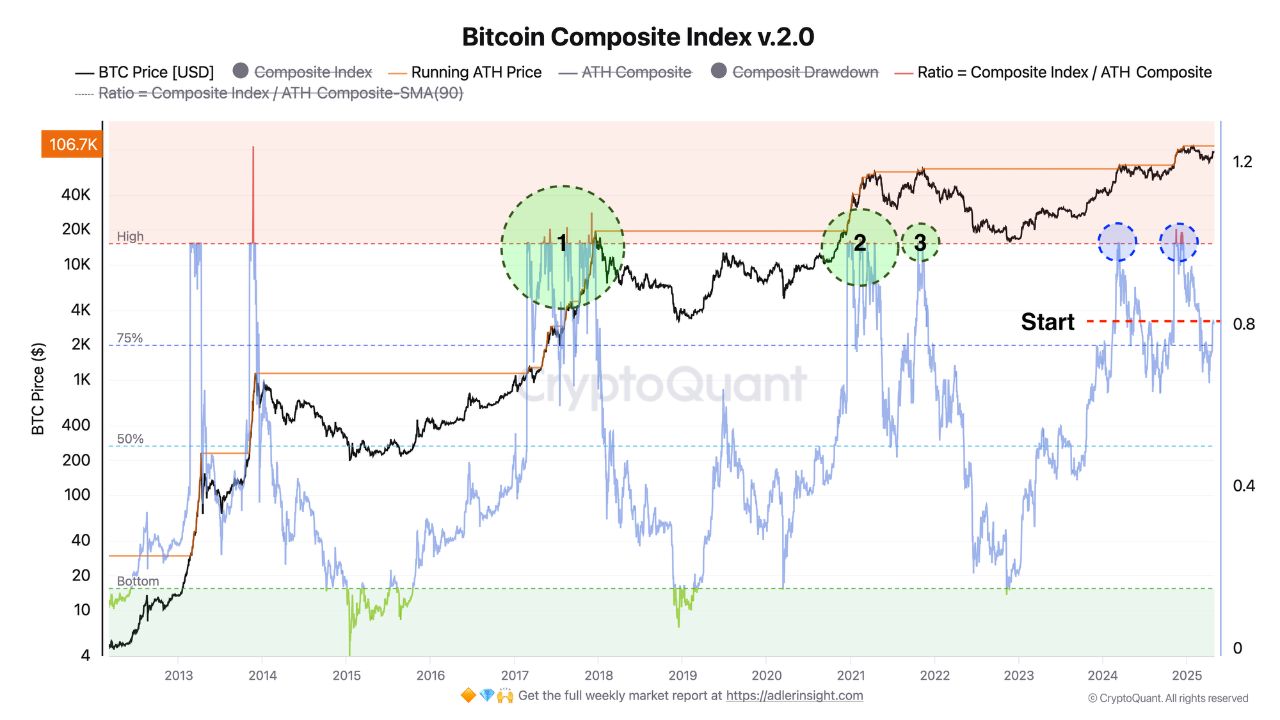
The Bitcoin Composite Index currently stands at ≈ 0.8 (80%). Based on this indicator, AxelAdlerJr outlined three possible scenarios.
In the most optimistic scenario, BTC’s price could reach $150,000 to $175,000, following the cyclical logic of 2017 and 2021. This would occur if the Bitcoin Composite Index surpasses 1.0 and remains above that level.
If the ratio stays within the 0.8–1.0 range, the market would likely consolidate in a broad corridor between $90,000 and $110,000, indicating that participants are maintaining positions without increasing exposure.
Alternatively, if the ratio drops to 0.75 or below, short-term holders may start taking profits, potentially leading to a price correction to $70,000–$85,000. However, AxelAdlerJr notes that this scenario is less likely than the other two.
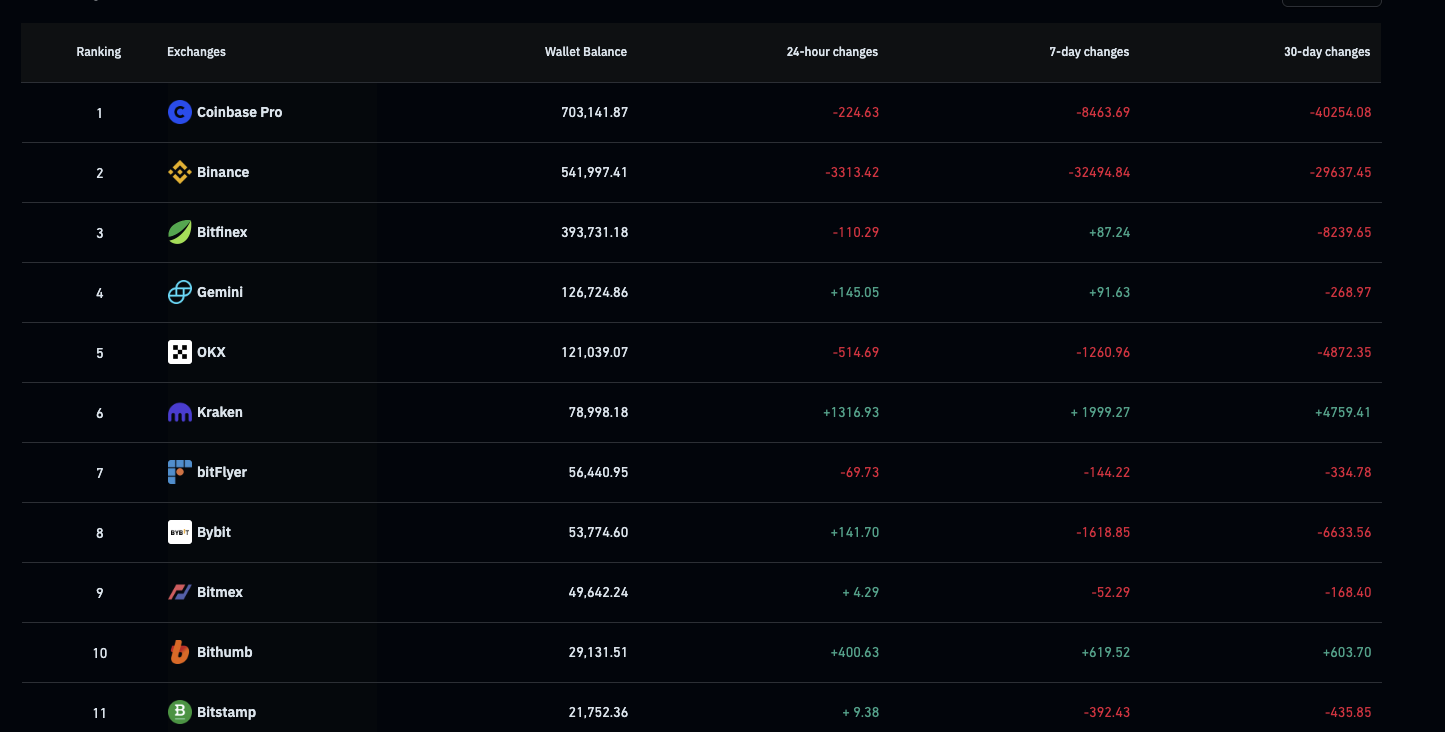
On-chain signals further bolster the bullish outlook. According to Coinglass, over the past 7 days, approximately 42,525.89 Bitcoins were withdrawn from centralized exchanges (CEX), reducing the supply on exchanges to a 7-year low of about 2.48 million BTC.
The trend of Bitcoin withdrawals from exchanges is often seen as a positive sign, as it indicates investor accumulation and reduced selling pressure, paving the way for price growth.
Bitcoin’s 7-day volatility has also hit its lowest level in 563 days. Low volatility typically signals a period of accumulation before a price breakout, as observed during past major rallies, such as in 2020 before Bitcoin peaked at $69,000.

Technical Analysis and Key Price Levels
Technical analysis also supports Bitcoin’s bullish scenario. According to a post on X by Ali, Bitcoin’s key support levels are at $93,198 and $83,444, indicating strong consolidation above these thresholds.
If Bitcoin sustains above $93,198, the likelihood of continuing its upward trend to reach the $150,000 target becomes highly feasible.
“The most critical support levels for #Bitcoin $BTC are $93,198 and $83,444. Key zones to watch if momentum shifts,” Ali shared.
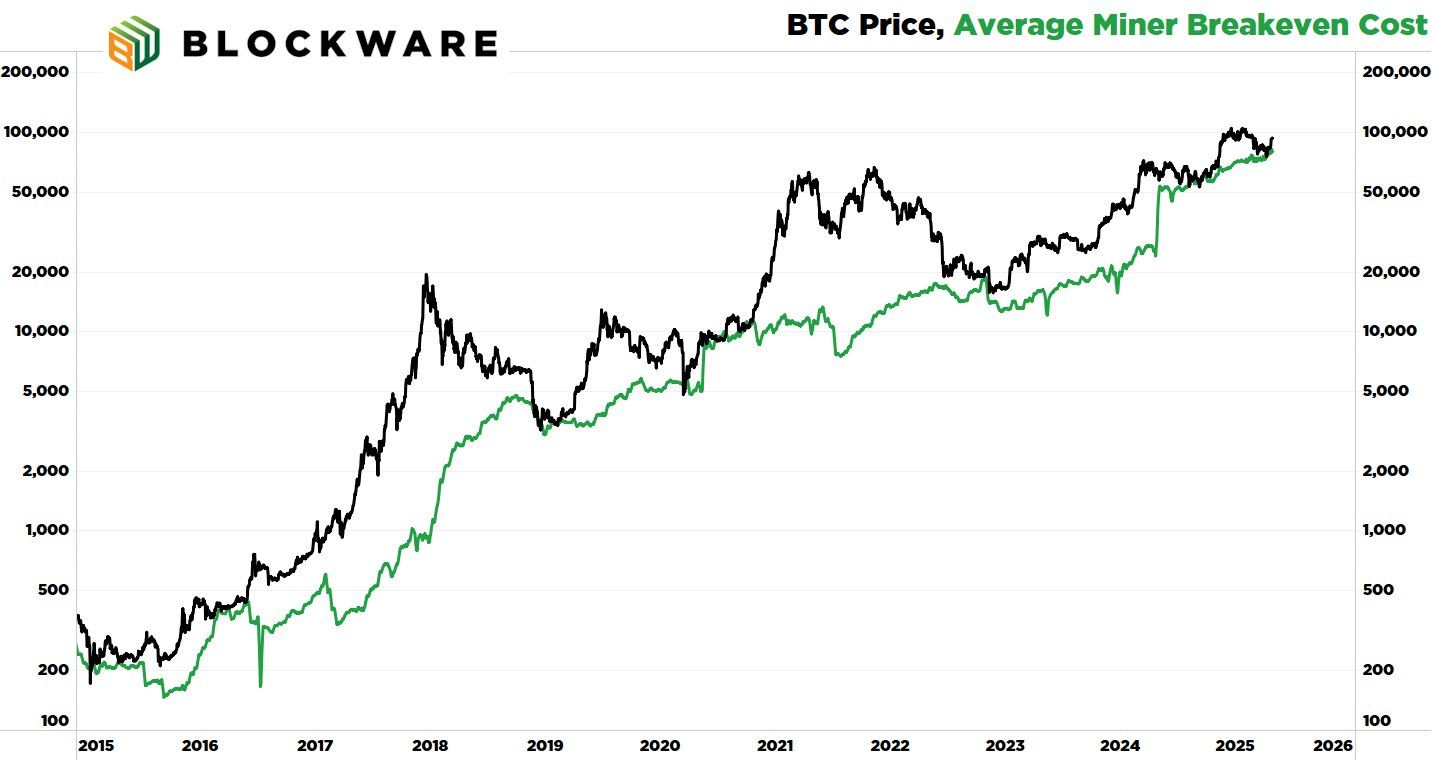
Moreover, Breedlove22, a well-known analyst, shared on X about three indicators signaling optimism for Bitcoin. The first is the Average Miner Cost of Production. According to Breedlove22, this metric is at a bottom, suggesting a significant bull market may be on the horizon.
The second indicator is the supply held by long-term holders, which measures Bitcoin unmoved on-chain for at least 155 days. Breedlove22 noted that over the past 30 days, long-term holders have acquired an additional ~150,000 BTC.
“Bitcoin is running out of sellers in the $80,000 to $100,000 range,” Breedlove22 stated.
Lastly, and most importantly, is USD liquidity, which effectively represents the “demand” side of the equation. More dollars in the system mean more potential bidders.
“And it’s not just USD liquidity that’s increasing – liquidity of all fiat currencies is on the rise, and Bitcoin is a global asset,” Breedlove22 added.
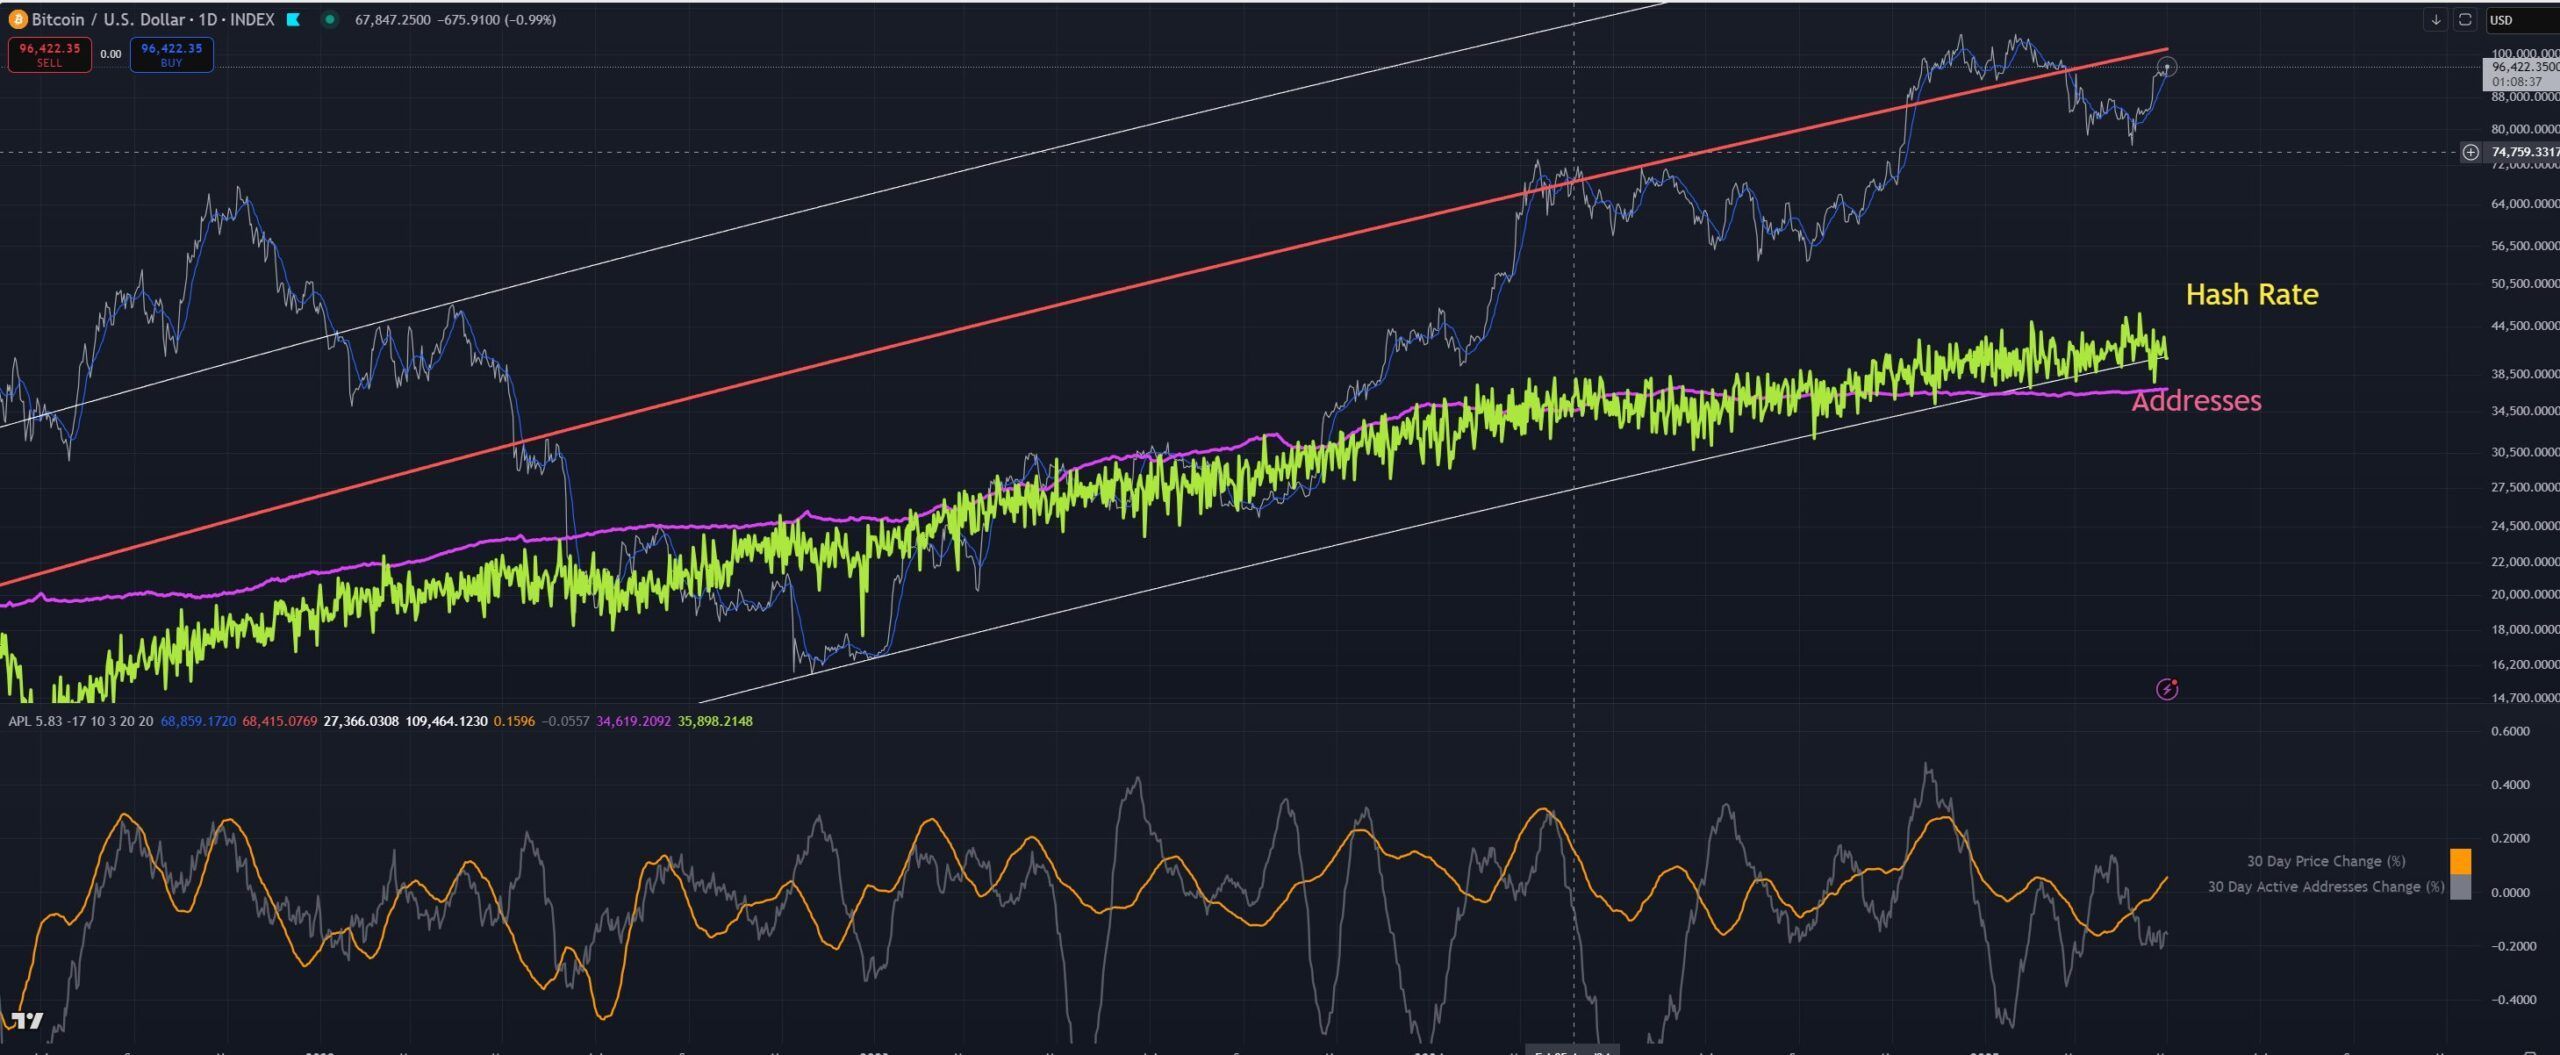
Echoing Breedlove22’s perspective, another X user shared that BTC’s valuation based on hash rate is at a support level, suggesting that a local bottom may have been reached.
In the optimistic scenario, Bitcoin is poised for a significant opportunity to reach $150,000 to $175,000. However, investors should also prepare for risks such as short-term price corrections.
With strong support levels at $93,198 and $83,444, Bitcoin has a solid foundation for continued growth, but caution remains essential.
Disclaimer: The content of this article solely reflects the author's opinion and does not represent the platform in any capacity. This article is not intended to serve as a reference for making investment decisions.
You may also like
Is a major reversal in stock-bond allocation approaching? Bank of America issues rare signal: Bonds compete with stocks for capital for the first time in decades, S&P 500's return over the next ten years may be less than 5%
Savita Subramanian, Head of US Equity and Quantitative Strategy at Bank of America, said in an interview on Wednesday that the bond market is becoming attractive again and has, for the first time in decades, become a real competitor to the stock market.

Stop Using the Consumer Cycle to Analyze Micron (MU.US)! AI is Redefining NAND Logic, Enterprise SSDs Have Taken Over Pricing Power
Eudaemon Research previously assessed that within Micron's business structure, DRAM is more resilient than NAND, and that NAND prices and demand would return to normal faster. However, Micron's latest Q4 financial data has led them to revise this view: NAND is no longer a homogeneous market, and the supply-demand and pricing dynamics of consumer-grade NAND and enterprise-level data center SSDs are clearly diverging.
Micron's target price is significantly raised by investment banks, with a maximum of 3,000 USD
DA Davidson has raised Micron's target price to $3,000, implying a 176% upside from the current share price. The core logic is that the AI-driven memory supercycle will continue until 2028, with the supply-demand gap widening further. The key variable lies in the shift of demand—buyers are transitioning from smaller, high-default-risk clients to tech giants such as Amazon, Microsoft, and Google. Micron has already secured $150 billion in remaining contractual obligations.
Oil prices continue to surge, triggering inflation concerns; global stock markets under pressure, Korean stocks close down 2.6%, US Treasury yields rise
Brent crude oil rose about 2.5% on Thursday, surpassing the $102 per barrel mark. Driven by this surge, the U.S. 10-year Treasury yield climbed 3 basis points to 5.31%, approaching its highest level since 2002. Asian stock markets followed the downward trend of U.S. stocks on Wednesday, with an overall decline of 1.2%. Japan's Nikkei 225 closed down 1.4%, and South Korea's Seoul Composite Index plunged 2.6%.
Crypto prices
More


