
Pi Network Crashes Again After a Brief Rally – What’s Next for PI?

Pi Network (PI) struggles to maintain momentum as bearish indicators dominate the chart. Price action stays below the cloud, with key support in focus.
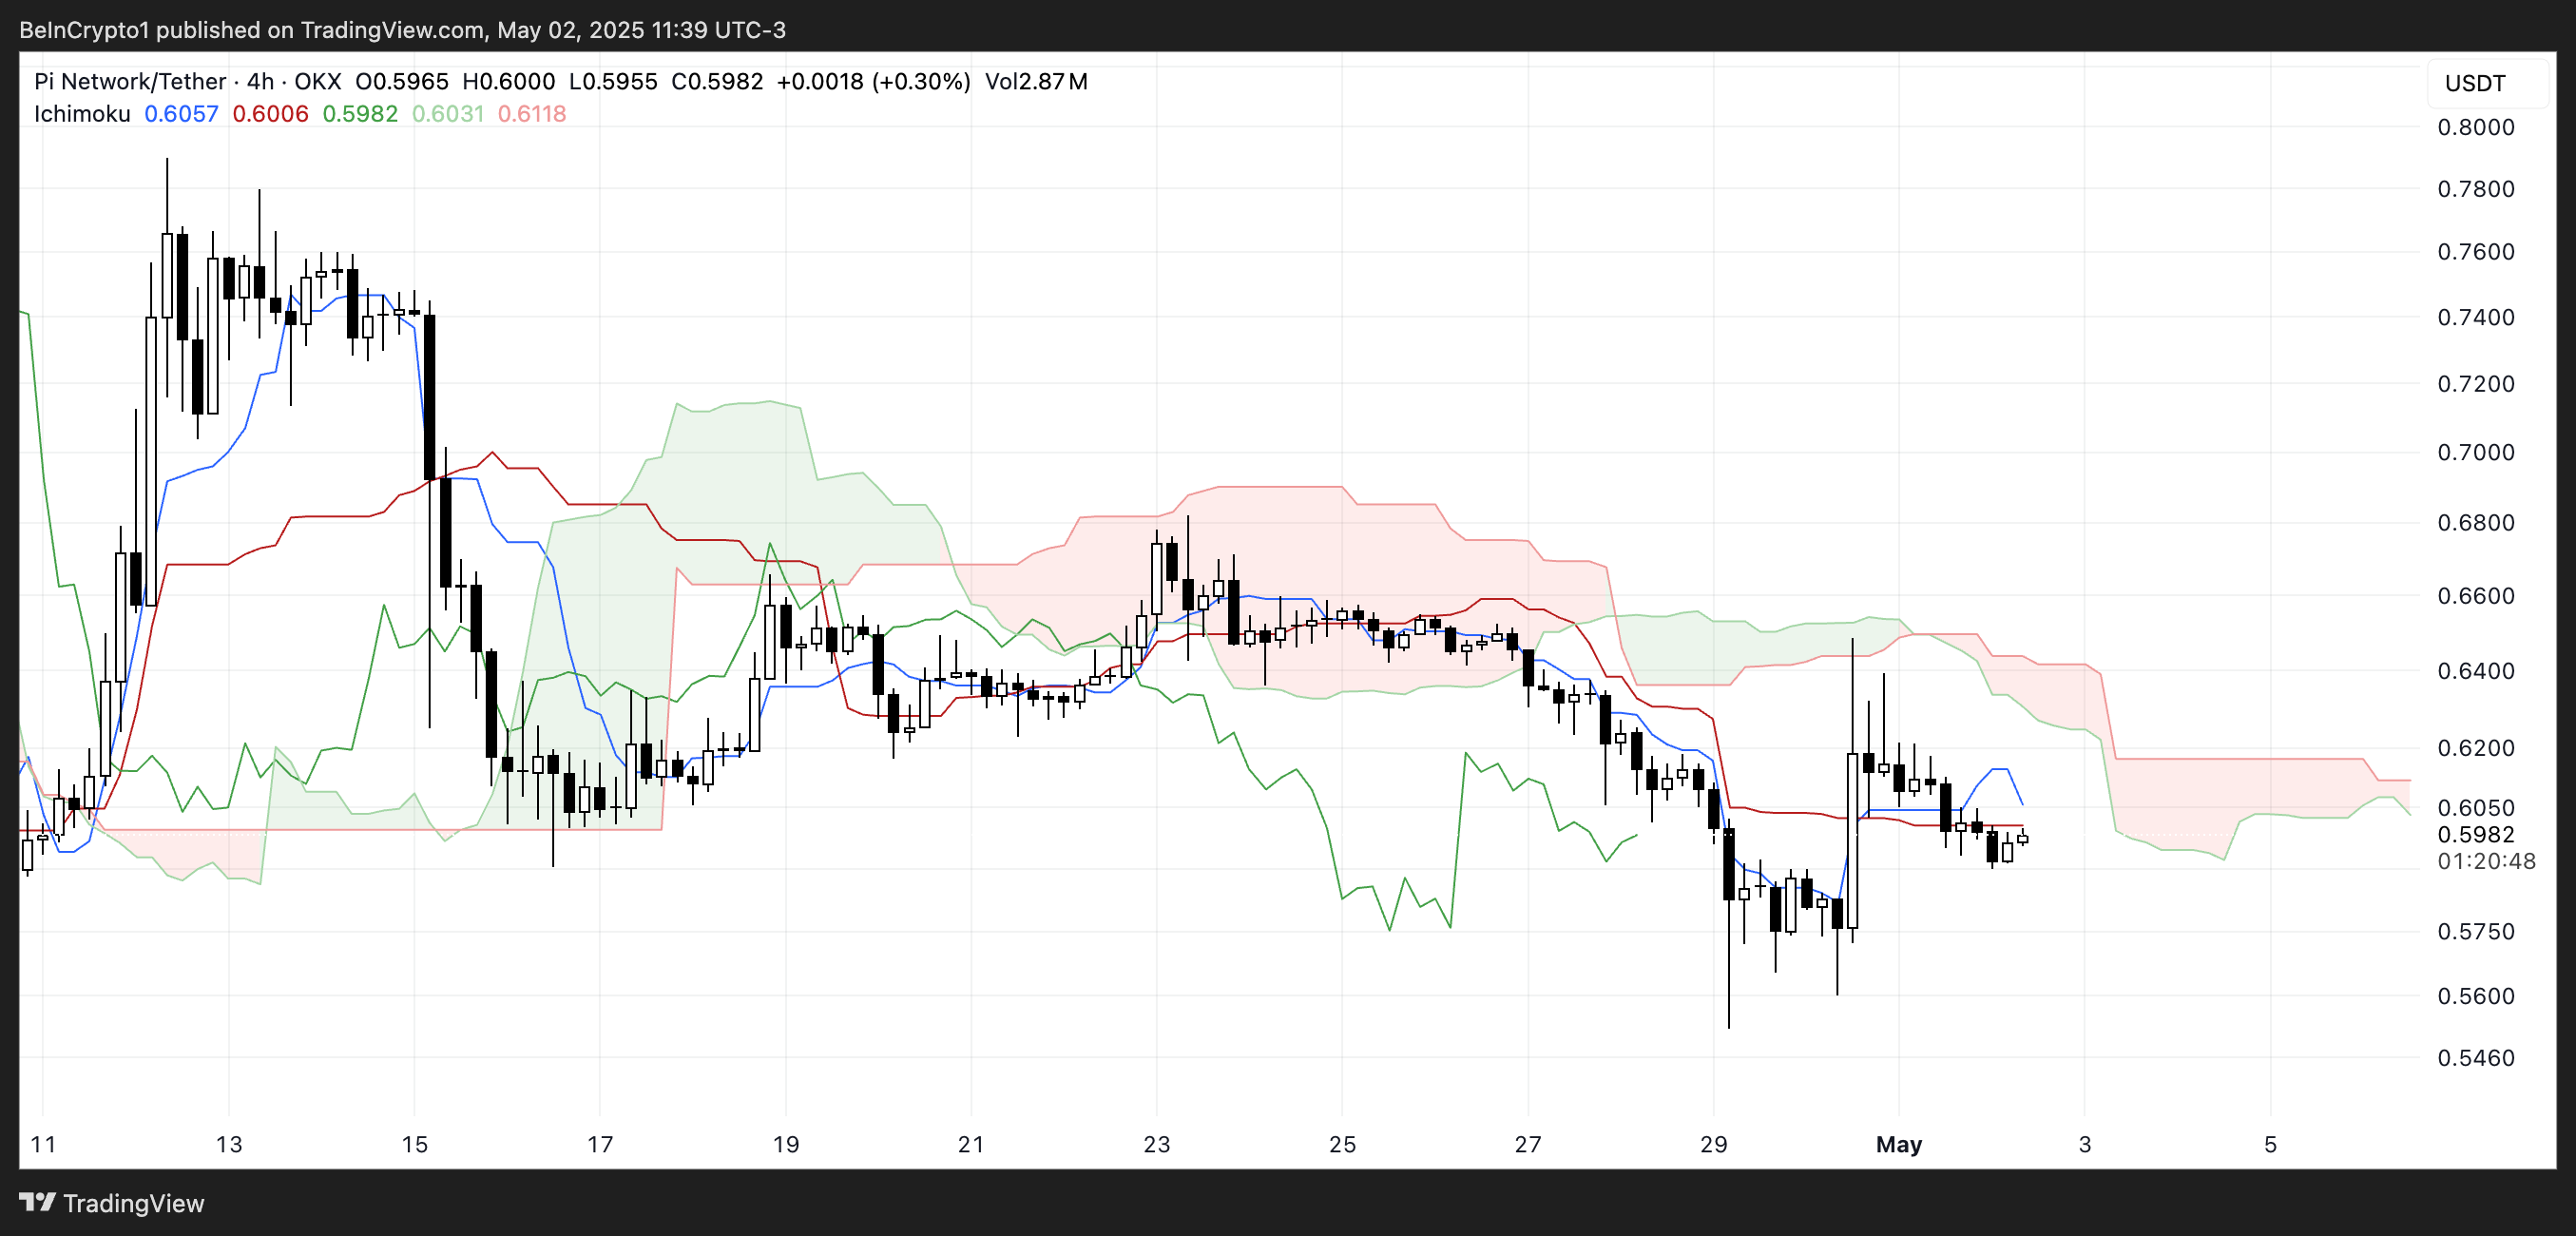
Pi Network (PI) has been down more than 8.5% in the last seven days. It has traded below $0.65 for six straight days but crashed below $0.60 today. The trend remains weak, with price action stuck below the Ichimoku Cloud.
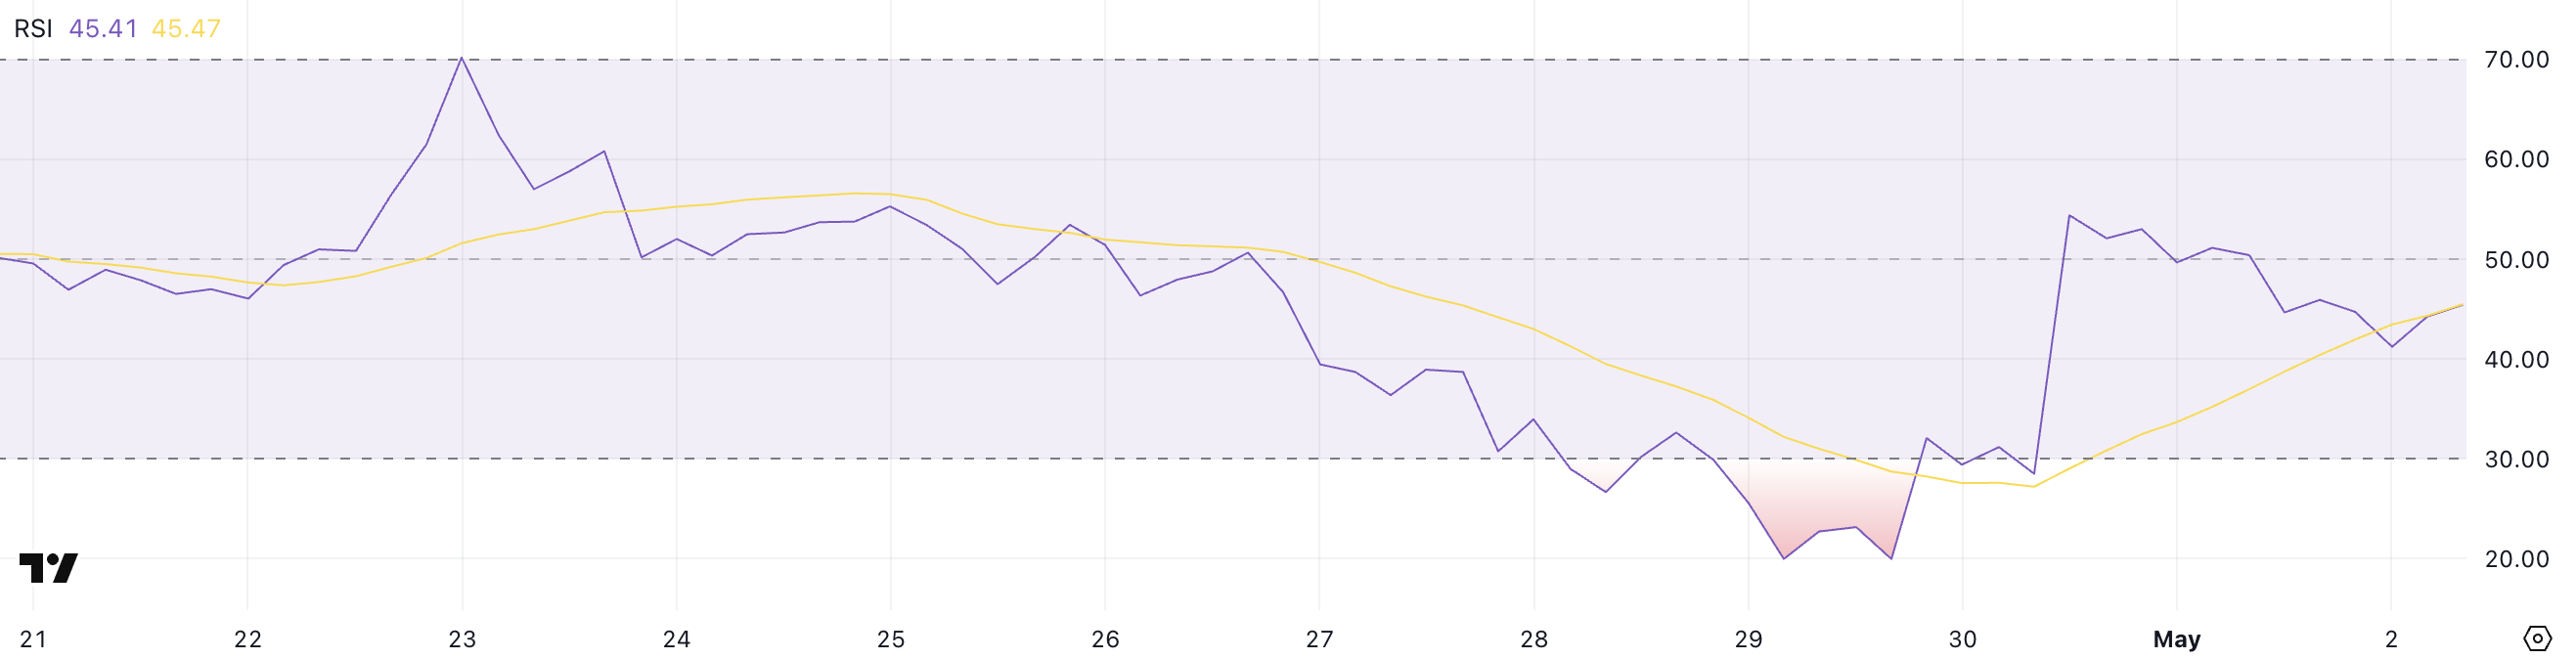
The altcoin’s RSI briefly went above 50 but has dropped back to 45, showing fading bullish momentum. EMAs are still bearish. It’s hovering just above key support, and the next move may decide between a deeper drop and a potential rebound.
Pi Network Faces Bearish Pressure Below the Ichimoku Cloud
Pi Network is still trading below the Ichimoku Cloud, signaling a bearish market structure overall. However, a potential shift may be developing, as the blue Tenkan-sen (conversion line) has recently crossed above the red Kijun-sen (base line).
This crossover is often seen as an early bullish signal, especially if confirmed by rising volume or a move into the cloud.
Despite this, the future cloud remains red, indicating continued resistance ahead and signaling that the broader trend is still under pressure.
 PI Ichimoku Cloud. Source:
TradingView.
PI Ichimoku Cloud. Source:
TradingView.
The Chikou Span (lagging line) is still below both the price candles and the cloud. This means any upside move has not yet been confirmed.
For a real trend reversal, PI must break into and above the cloud. The future cloud must also turn green, with all Ichimoku signals aligning bullishly.
Right now, the setup shows indecision. There’s a short-term bullish crossover, but the price is still under the cloud, and the broader trend remains bearish.
Pi Network Momentum Slows as RSI Dips Below 50
Pi Network’s RSI currently sits at 45.41, easing off after a sharp rally from 28.49 to 54.40 just two days ago. This indicates a slowdown in momentum following a brief period of recovery.
The pullback from above 50 suggests that buying pressure has weakened, and PI is entering a more neutral zone, where neither bulls nor bears are in full control.
The quick reversal also reflects uncertainty in the current price trend.
 PI RSI. Source:
TradingView.
PI RSI. Source:
TradingView.
The Relative Strength Index (RSI) is a momentum oscillator ranging from 0 to 100, commonly used to identify overbought or oversold conditions.
Readings above 70 suggest an asset may be overbought and due for a correction, while readings below 30 indicate oversold conditions and potential for a bounce. Values between 30 and 70 are considered neutral, with 50 as the key pivot point.
PI’s current RSI at 45.41 is below that threshold, hinting at a slight bearish lean unless the metric turns back upward. If RSI continues to decline, it may reflect growing selling pressure and a risk of further price weakness.
Pi Network Hovers Near Key Support With Bearish EMAs
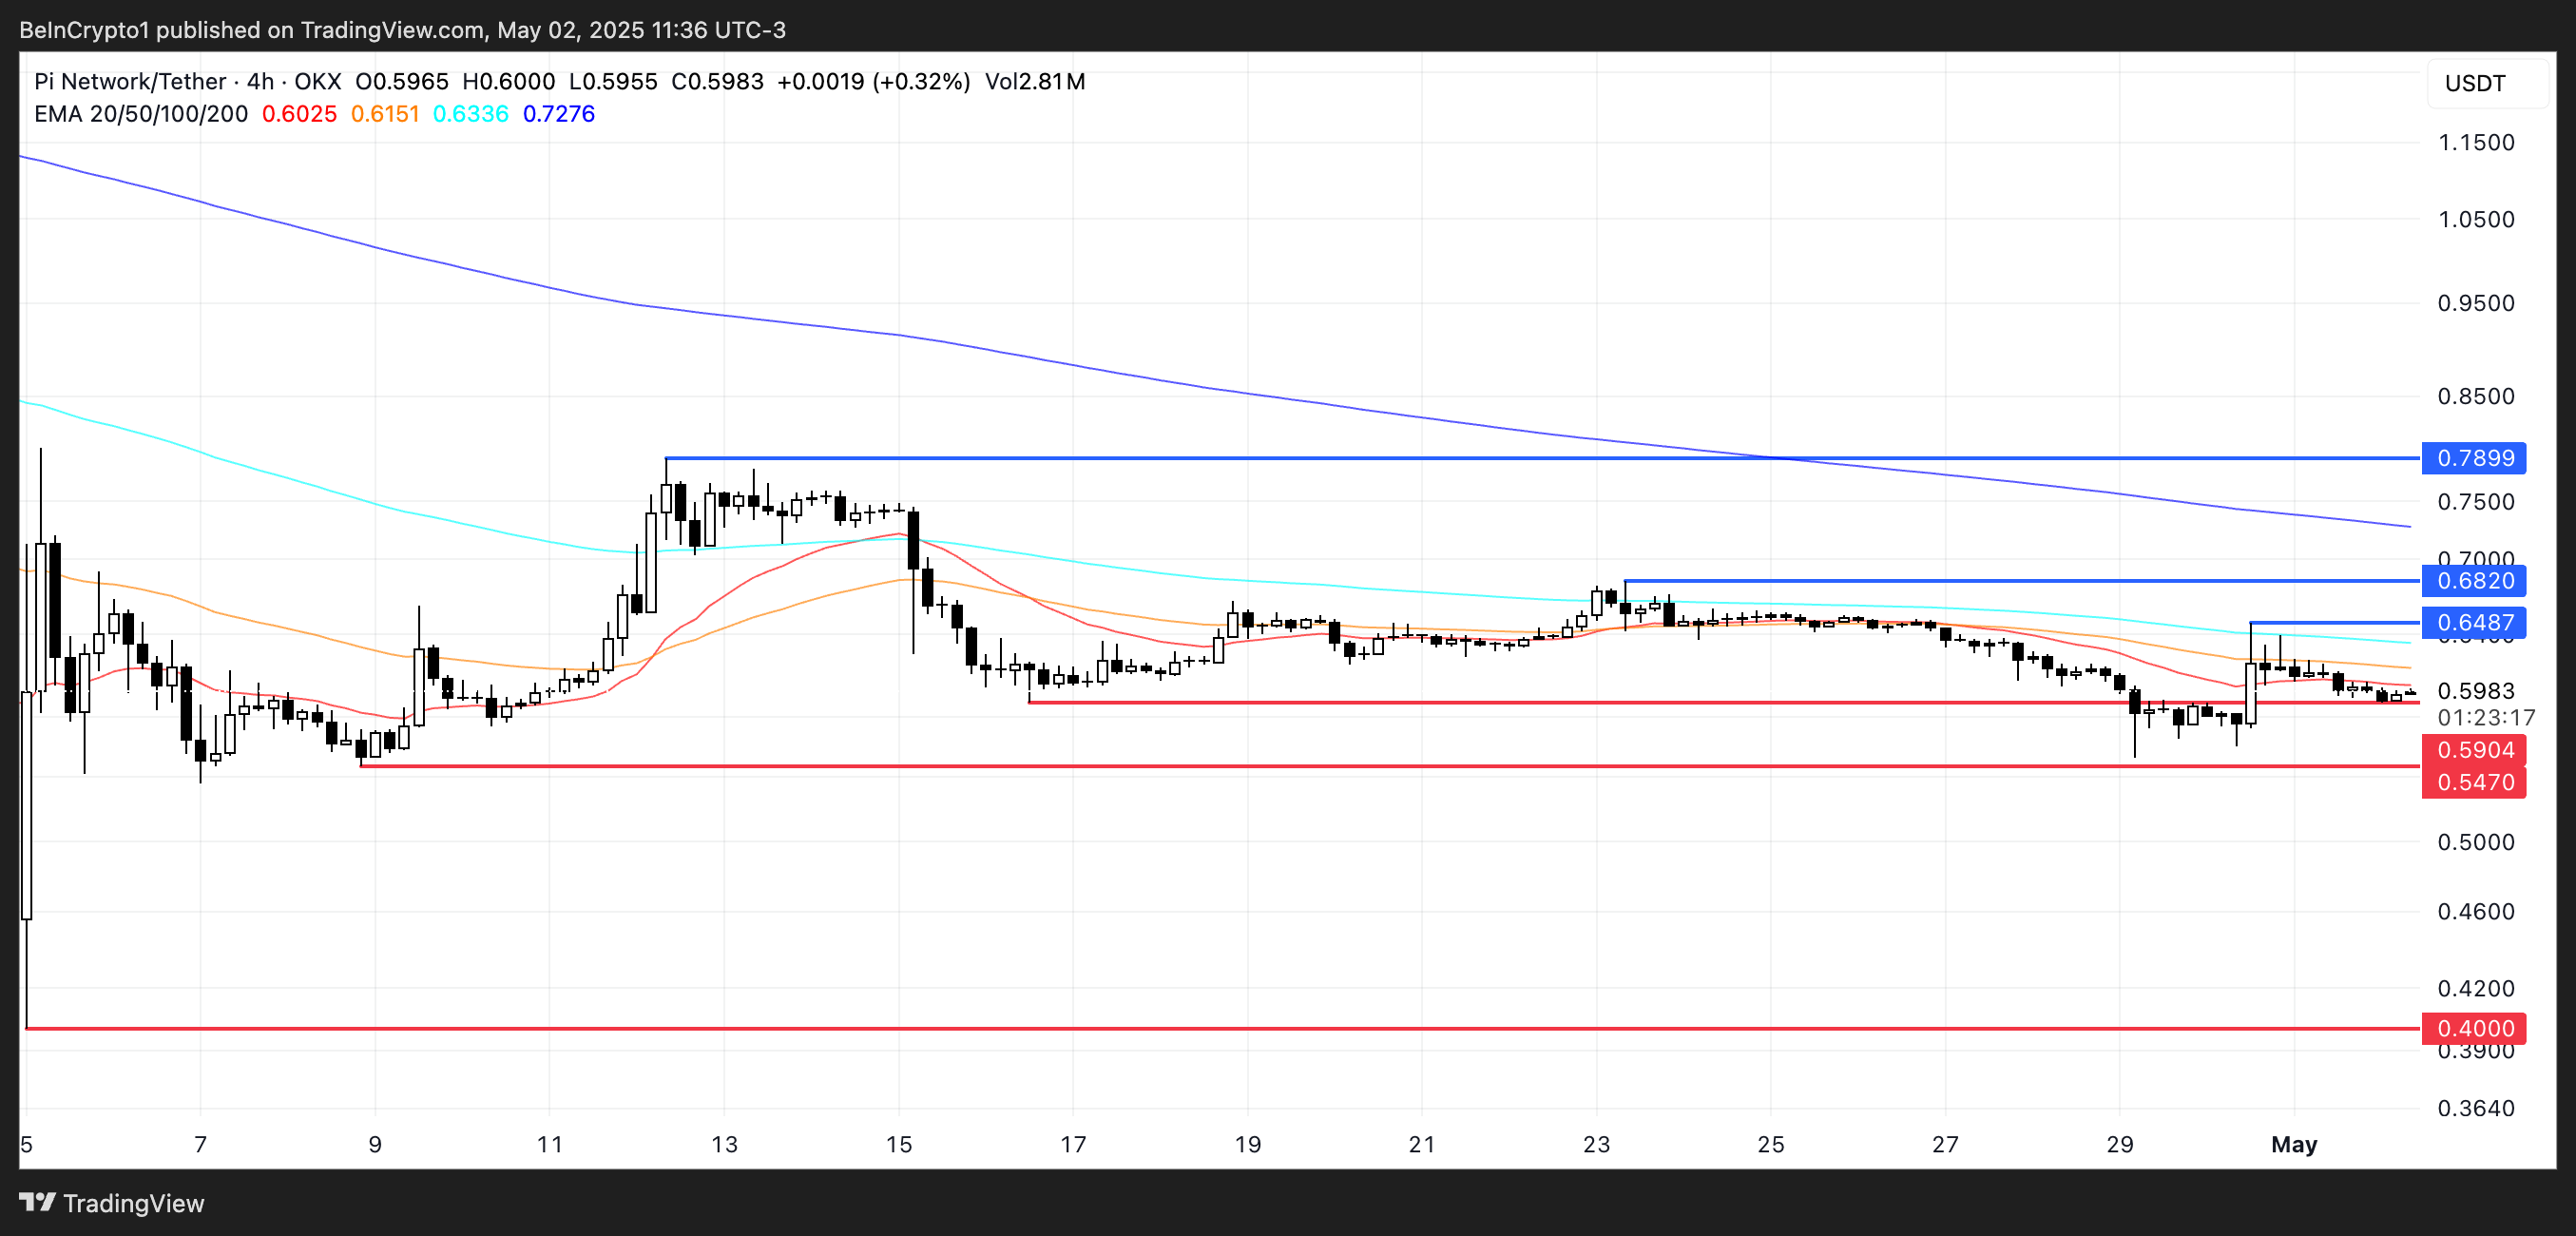
PI price is trading just above a key support at $0.59, with bearish pressure building.
If this level is tested and broken, the next important supports lie at $0.547 and $0.40, potentially exposing the token to a deeper correction.
 PI Price Analysis. Source:
TradingView.
PI Price Analysis. Source:
TradingView.
The Exponential Moving Averages (EMAs) remain in a bearish alignment, with short-term EMAs positioned below the long-term ones. This structure typically signals that the broader trend is still downward.
However, if the trend reverses and buyers step in, PI could climb to test resistance at $0.648, followed by $0.682.
A breakout above both—especially if supported by volume and a bullish EMA crossover—could push the price toward $0.789, signaling a shift toward a more sustained uptrend.
Disclaimer: The content of this article solely reflects the author's opinion and does not represent the platform in any capacity. This article is not intended to serve as a reference for making investment decisions.
You may also like
CDS Soar Collectively, "SpaceX and Others" Still Borrowing Furiously! How Long Can the AI Debt Frenzy Last?
The wave of AI infrastructure debt is reshaping the global credit landscape at an unprecedented pace, with the technology industry's debt reaching $500 billion in the first nine months of this year. However, frequent alarms have been raised in the CDS market, US Treasury yields have climbed to 5.3%, the highest in over twenty years, and Dalio pointed out that this is a "classic bubble that will be burst by interest rates."
Is a major reversal in stock-bond allocation approaching? Bank of America issues rare signal: Bonds compete with stocks for capital for the first time in decades, S&P 500's return over the next ten years may be less than 5%
Savita Subramanian, Head of US Equity and Quantitative Strategy at Bank of America, said in an interview on Wednesday that the bond market is becoming attractive again and has, for the first time in decades, become a real competitor to the stock market.

Stop Using the Consumer Cycle to Analyze Micron (MU.US)! AI is Redefining NAND Logic, Enterprise SSDs Have Taken Over Pricing Power
Eudaemon Research previously assessed that within Micron's business structure, DRAM is more resilient than NAND, and that NAND prices and demand would return to normal faster. However, Micron's latest Q4 financial data has led them to revise this view: NAND is no longer a homogeneous market, and the supply-demand and pricing dynamics of consumer-grade NAND and enterprise-level data center SSDs are clearly diverging.
Micron's target price is significantly raised by investment banks, with a maximum of 3,000 USD
DA Davidson has raised Micron's target price to $3,000, implying a 176% upside from the current share price. The core logic is that the AI-driven memory supercycle will continue until 2028, with the supply-demand gap widening further. The key variable lies in the shift of demand—buyers are transitioning from smaller, high-default-risk clients to tech giants such as Amazon, Microsoft, and Google. Micron has already secured $150 billion in remaining contractual obligations.
Crypto prices
More


