Date: Tue, May 06, 2025 | 06:10 PM GMT
The cryptocurrency market has seen a much-needed relief rally over the past couple of weeks. While major altcoins have already made their short upside moves, Kaito (KAITO) was lagging behind. Now, it looks ready to catch up.
The token surged over 8% today, and a classic harmonic pattern on its chart is hinting that a short-term rebound might be around the corner.
 Source: Coinmarketcap
Harmonic Pattern Signals More Upside
On the daily chart, KAITO is currently forming what appears to be a Bearish Gartley harmonic pattern — a technical formation often known for identifying potential reversal zones when the final leg (CD) completes.
The downtrend began around March 24, when KAITO failed to stay above the $1.40 resistance level (marked as point X). From there, it dropped over 50%, eventually bottoming out near $0.67 on April 17 (point A).
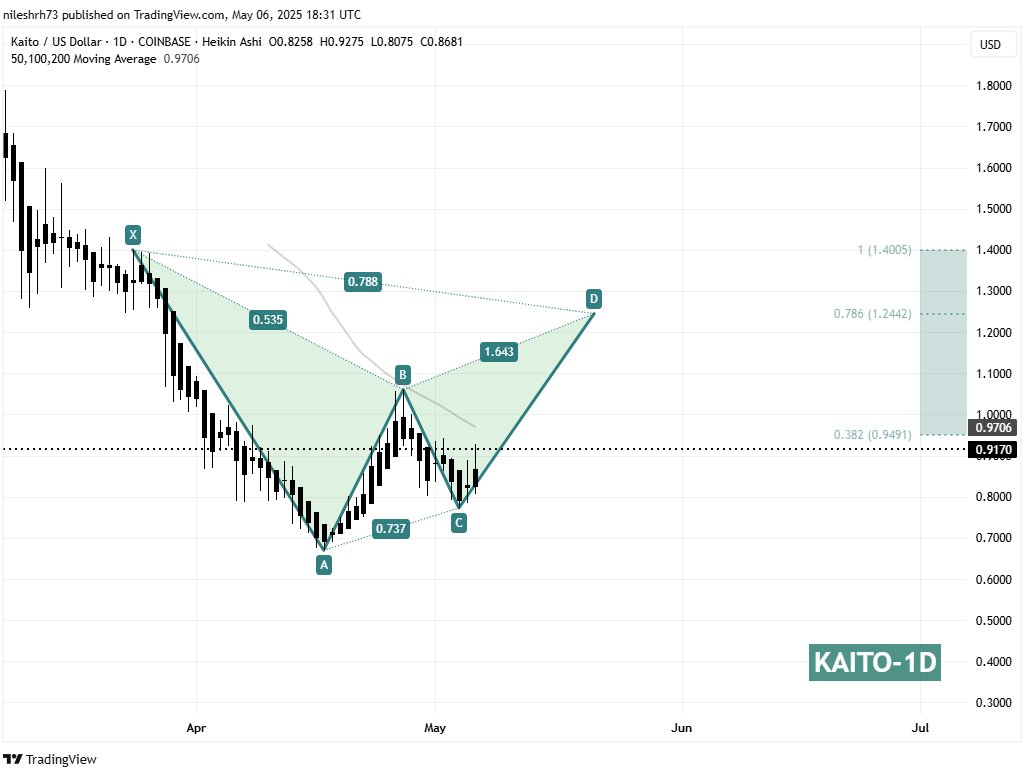 Kaito (KAITO) Daily Chart/Coinsprobe (Source: Tradingview)
The AB leg retraced about 53.5% of the XA move — a typical retracement for a valid Gartley. Then, after a healthy pullback in the BC leg (~73.7% retracement), KAITO began bouncing again from the C point low around $0.77. As of now, it seems to be completing the CD leg — aiming for the potential reversal zone at point D.
Where Could It Go?
If this harmonic pattern plays out, KAITO may rally up to $1.24 — which aligns with the 78.6% Fibonacci retracement of the initial XA move. This represents a possible 37% upside from the current price of around $0.91.
But that’s not the end. If bulls manage to break through this crucial resistance zone at $1.24, it opens the door for a full recovery toward the previous high near $1.40 — which is over 53% upside from here.
This zone is also visually marked on the chart as the upper boundary of the pattern. However, traders should note that point D also often acts as a turning point, so some profit-taking or consolidation is likely in that area.
Disclaimer: This article is for informational purposes only and not financial advice. Always conduct your own research before investing in cryptocurrencies.