

Date: Sat, May 10, 2025 | 12:38 PM GMT
The cryptocurrency market continues to build on its recent strength, with Bitcoin (BTC) and Ethereum (ETH) leading the charge. Bitcoin has now crossed the $103K mark, while Ethereum has gained over 52% in the past 30 days and is currently trading above $2,400 — its highest level in several months. This positive sentiment is flowing into altcoins as well, and one of the notable performers is Chainlink (LINK).
LINK has jumped over 31% in monthly gains and is now trading near $16.30. The current chart structure suggests that the rally may still be in its early stages, with a potential for further upside in the coming weeks.
 Source: Coinmarketcap
Inverse Head and Shoulders Breakout Detected
A powerful bullish signal is flashing on the LINK daily chart — the formation of an inverse head and shoulders pattern. This classic chart pattern is often seen at the bottom of a downtrend and typically signals a reversal in market direction.
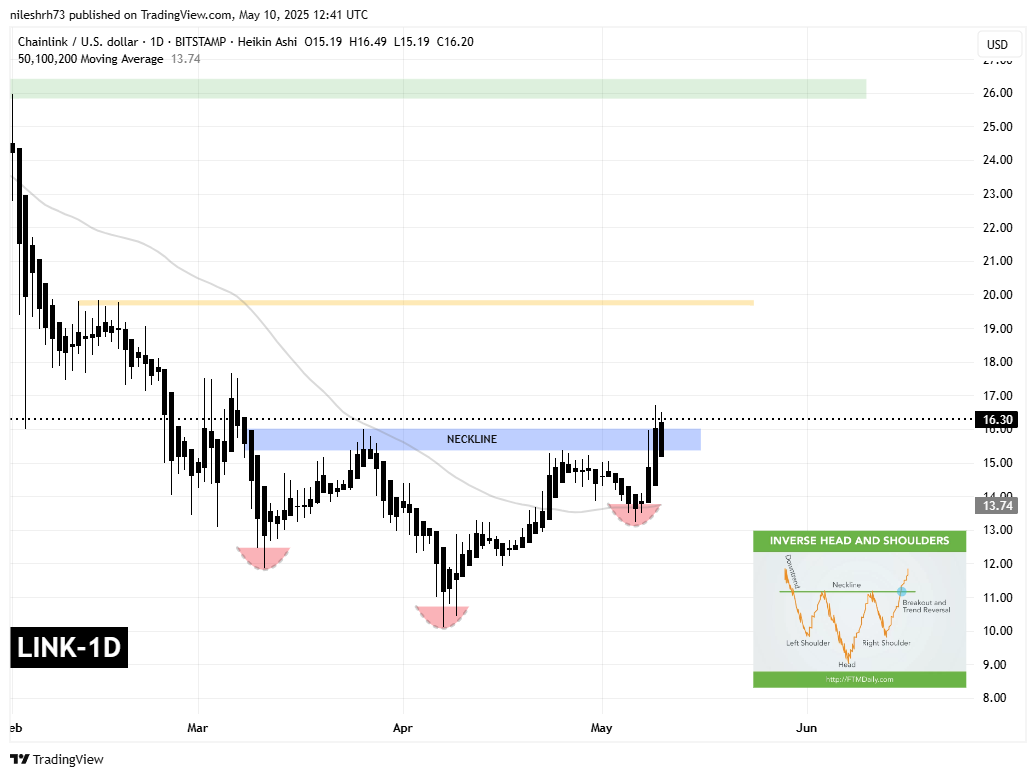 Chainlink (LINK) Daily Chart/Coinsprobe (Source: Tradingview)
The left shoulder in this pattern formed back in mid-March, when LINK dipped to a low of $11.36. The head was created in early April, marked by a deeper low at $10.10. Most recently, the right shoulder formed just above the 50-day moving average, near the $13.74 level, showing signs of growing support at higher levels.
The key breakout occurred when LINK pushed above the neckline resistance, which had been capping the price near the $16.00 zone for several weeks. This breakout was not only confirmed by strong bullish Heikin Ashi candles but also by an increase in trading volume, a strong indicator that buyers are stepping in.
What’s Next for LINK?
While the breakout above the neckline is an encouraging sign for the bulls, the next phase is crucial. Ideally, LINK will either successfully retest the neckline as new support or continue to build momentum above it with sustained volume. If this happens, the next logical price target is the resistance zone around $19.40. This move would represent a 24% gain from the breakout level.
Should bullish momentum carry LINK past that level, the next significant resistance lies in the $25.95 zone, which is highlighted in green on the chart. A move to this area would represent a total upside of over 65% from the neckline breakout point, which could provide a substantial return for traders positioned early.
Disclaimer: This article is for informational purposes only and does not constitute financial advice. Always conduct your own research before making investment decisions in the cryptocurrency marke


