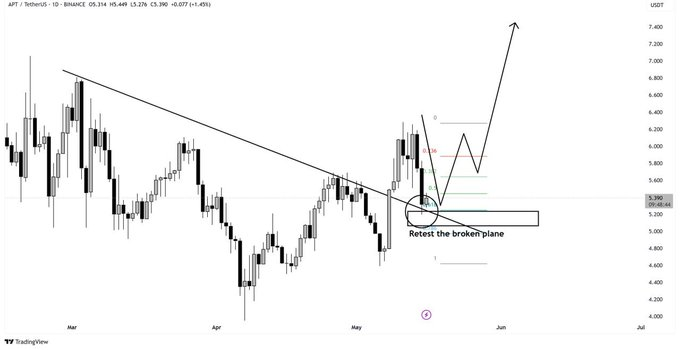
- APT has bounced off the 0.618 Fibonacci level near $5.20 which matches a broken trendline support.
- The chart pattern shows rising demand and higher lows which indicate strong buyer interest building again.
- If the price clears $6.20 then the next target near $7.40 may be reached without another pullback.
Aptos (APT) is now trading near $5.39 after successfully retesting its long-term descending trendline, signaling a bullish continuation. The retest occurred in confluence with the 0.618 Fibonacci retracement zone, a highly regarded technical setup. Analysts point to this formation as a textbook retest pattern with growing potential for a rally.
 Source: X
Price action on the daily chart suggests strength, with higher lows forming during the recent pullback. This indicates underlying buying interest and healthy market consolidation. With momentum favoring bulls, APT now approaches its next technical zones that could determine short-term direction.
Retest Aligns With Classic Technical Setup
APT has broken above a multi-month descending trendline, a significant shift in trend structure. The breakout was followed by a controlled pullback that tapped into a key support zone, validating the move. The zone of interest lies between the trendline and the 0.618 Fibonacci retracement, a critical area for bullish traders.
The retest confirms this former resistance is now acting as strong support. This kind of price behavior often precedes sharp directional moves when followed by sustained buying pressure. The drawn chart pattern projects a rising structure that targets higher levels once confirmation is observed.
The retracement zone around $5.20 has attracted attention from technical traders. Fibonacci-based levels like 0.382 and 0.618 have been used to measure retracement accuracy. The bounce from these levels increases the likelihood that APT may build toward higher targets in coming days.
Price Structure Hints at Upside Targets
APT has created a short-term base that shows strong alignment with bullish continuation principles. The rising wedge pattern suggests pressure is building for another upward move. Support around $5.20 has held despite brief dips, indicating buyer strength remains intact.
Technical targets have been mapped based on the current price behavior and previous swing highs. The first major target is positioned at $6.20, which reflects a prior resistance zone . A more extended move could send price toward $7.40 if momentum continues and volume builds.
Volume analysis shows steady accumulation throughout the retest, often a precursor to breakout rallies. Traders will look for sustained closes above recent swing highs to confirm momentum. If that happens, price may advance without revisiting the recent support level.
Can APT Hold This Zone for a Strong Rally?
The current structure remains supportive of an upward continuation as long as $5.20 maintains support. A failure to hold this level could challenge the current outlook. However, the combination of a trendline retest and Fibonacci bounce adds confidence to the bullish bias.
Market participants will monitor whether the recent pullback is followed by a clean push above $6.00. Confirmation from volume and RSI strength could further validate bullish intentions. Can Aptos deliver the move toward $7.40 from this textbook setup with trendline and Fibonacci support aligned?