
XRP Traders Bet on Reversal as Demand Builds at Key Support

Despite a recent 4% dip, XRP shows signs of a rebound fueled by strong trader interest and bullish technical indicators. Liquidation targets at $2.48 may drive near-term price action
XRP has slipped 4% over the past week amid a broader market pullback. As of this writing, the fourth-largest cryptocurrency by market capitalization trades at $2.31.
Amid strengthening bearish bias across the general market, on-chain data hints at a near-term rebound.
XRP Gears Up for Potential Rally
According to Coinglass, XRP’s liquidation heatmap shows a notable concentration of liquidity at the $2.48 price zone.
Liquidation heatmaps are visual tools traders use to identify price levels where large clusters of leveraged positions are likely to be liquidated. These maps highlight areas of high liquidity, often color-coded to show intensity, with brighter zones representing larger liquidation potential.
Usually, these price zones act as magnets for price action, as the market tends to move toward these areas to trigger liquidations and open fresh positions.
Therefore, for XRP, the cluster of liquidity at the $2.48 price level signals strong trader interest in buying or closing short positions at that price. This opens the door for a potential price rally in the near term.
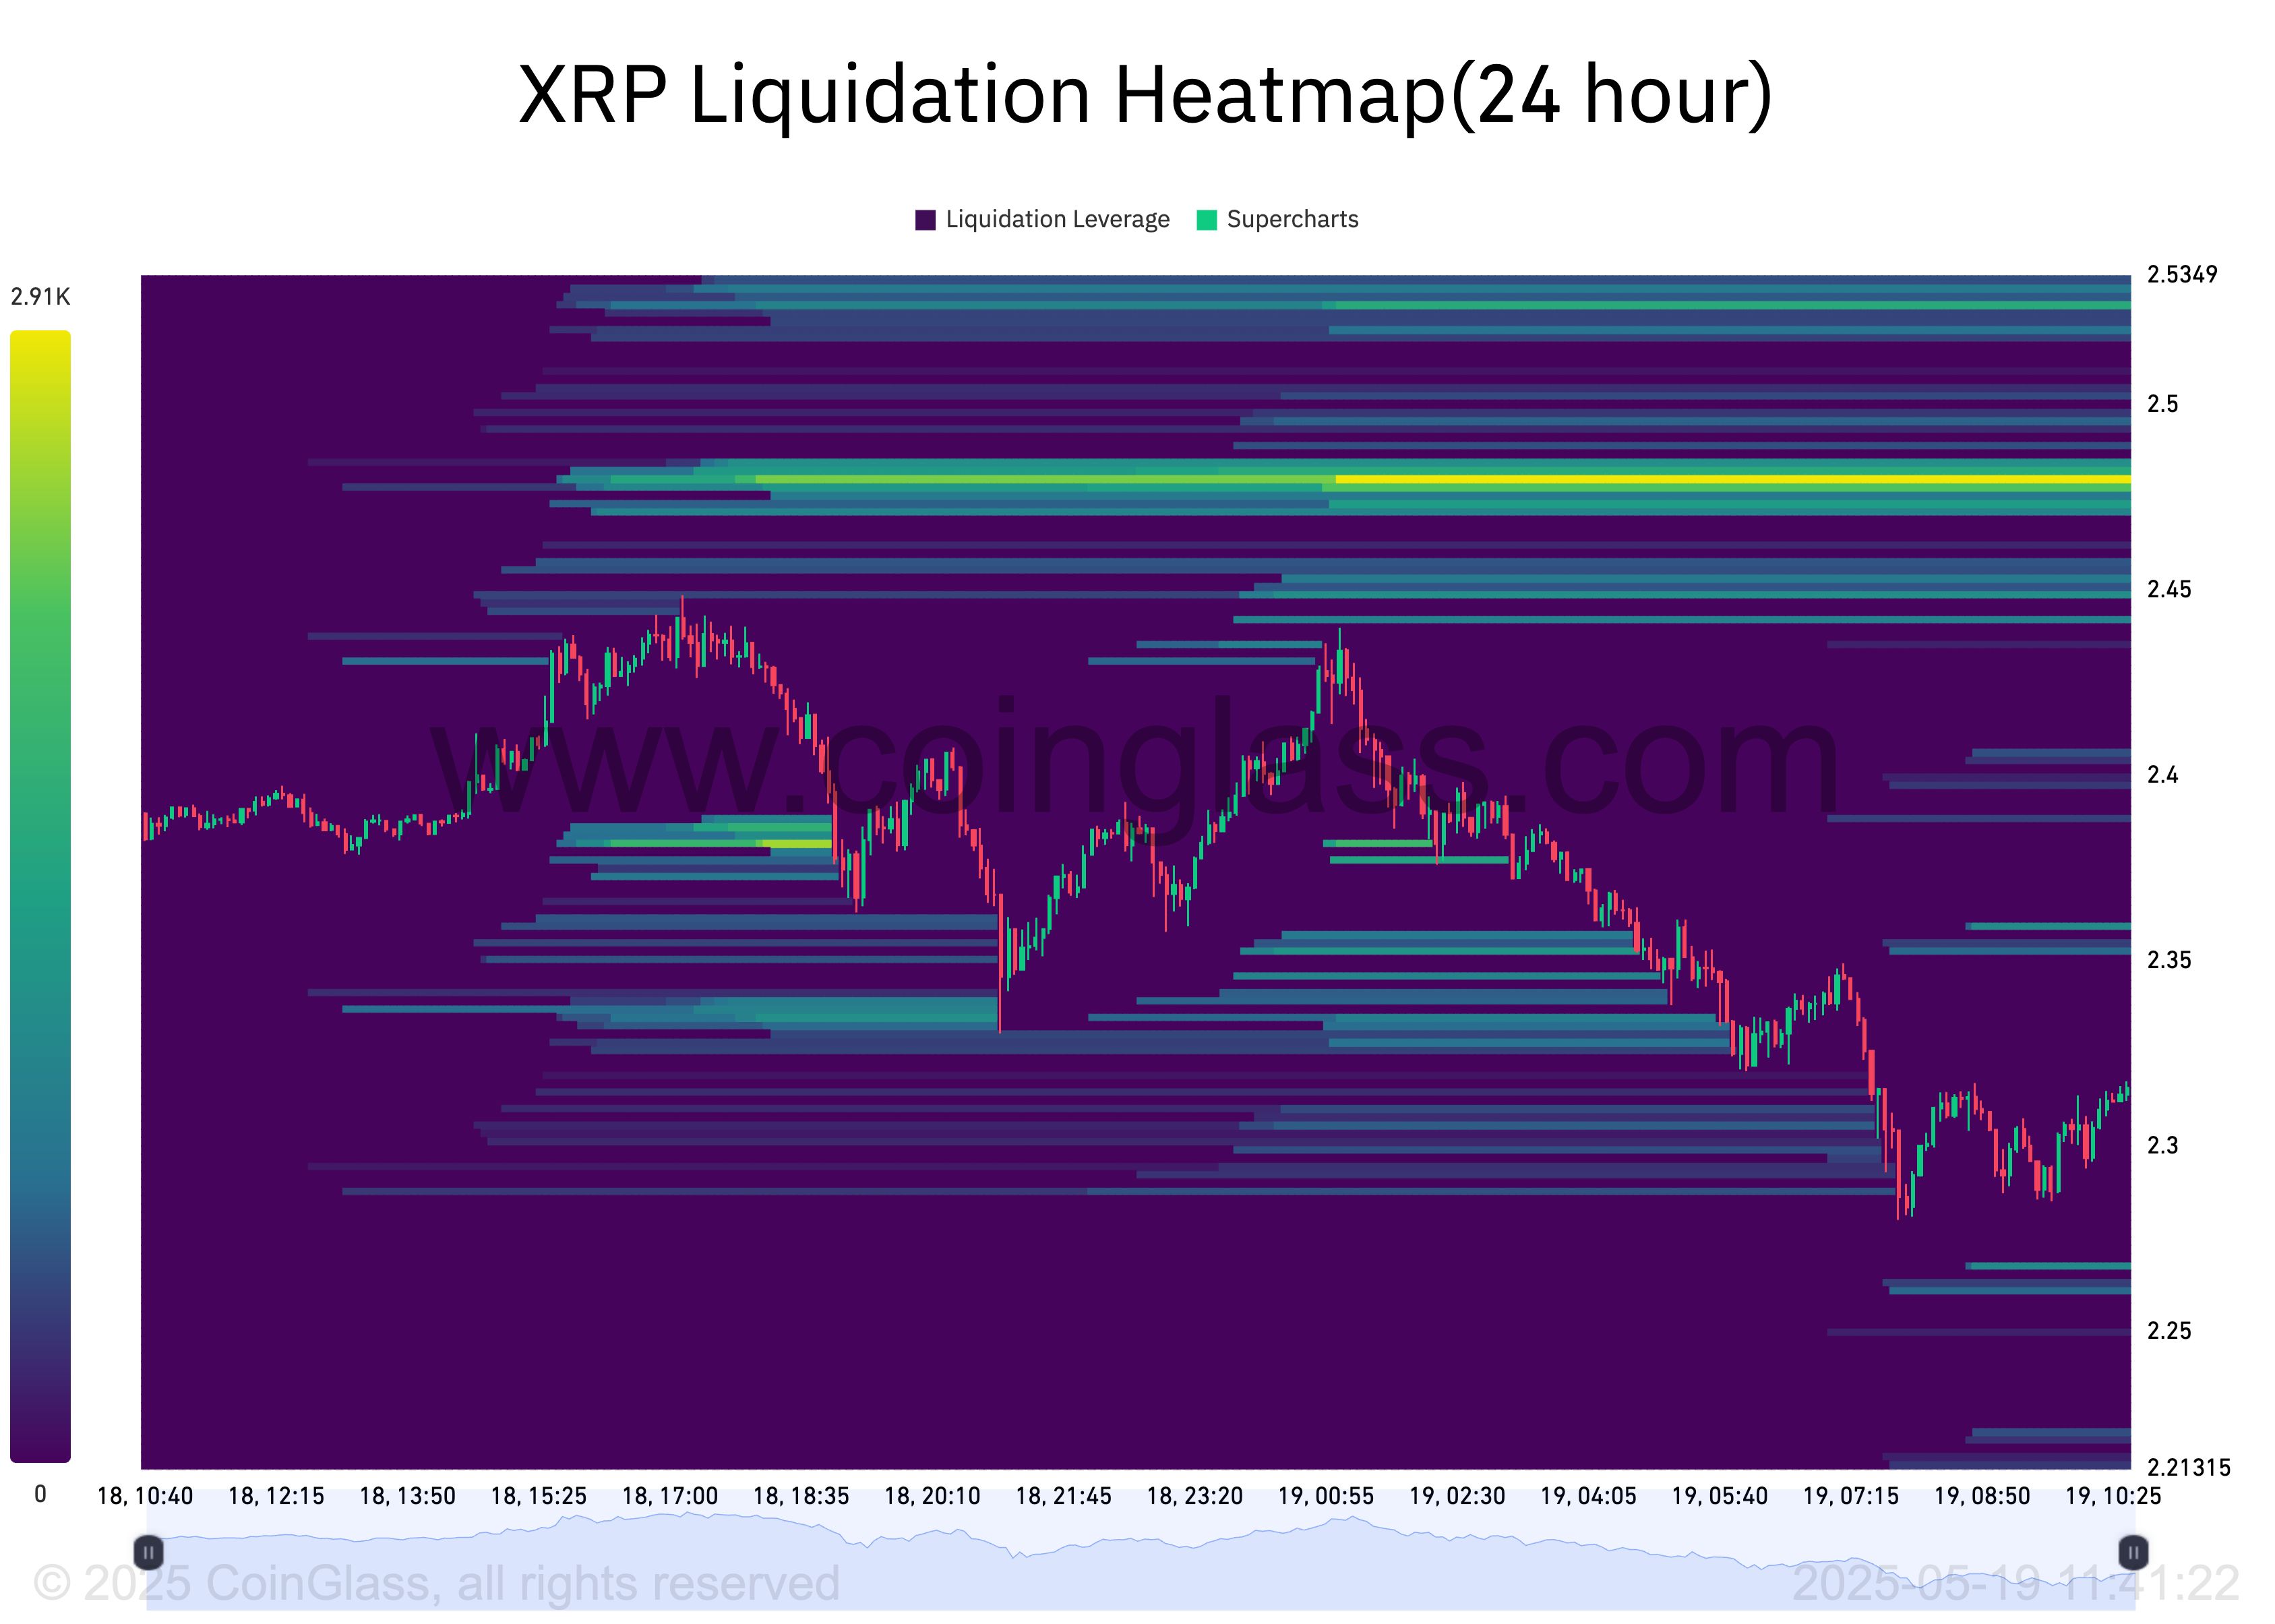 XRP Liquidation Heatmap. Source:
Coinglass
XRP Liquidation Heatmap. Source:
Coinglass
Further, the altcoin’s funding rate has remained positive despite its recent headwinds. Currently, this stands at 0.0041%.
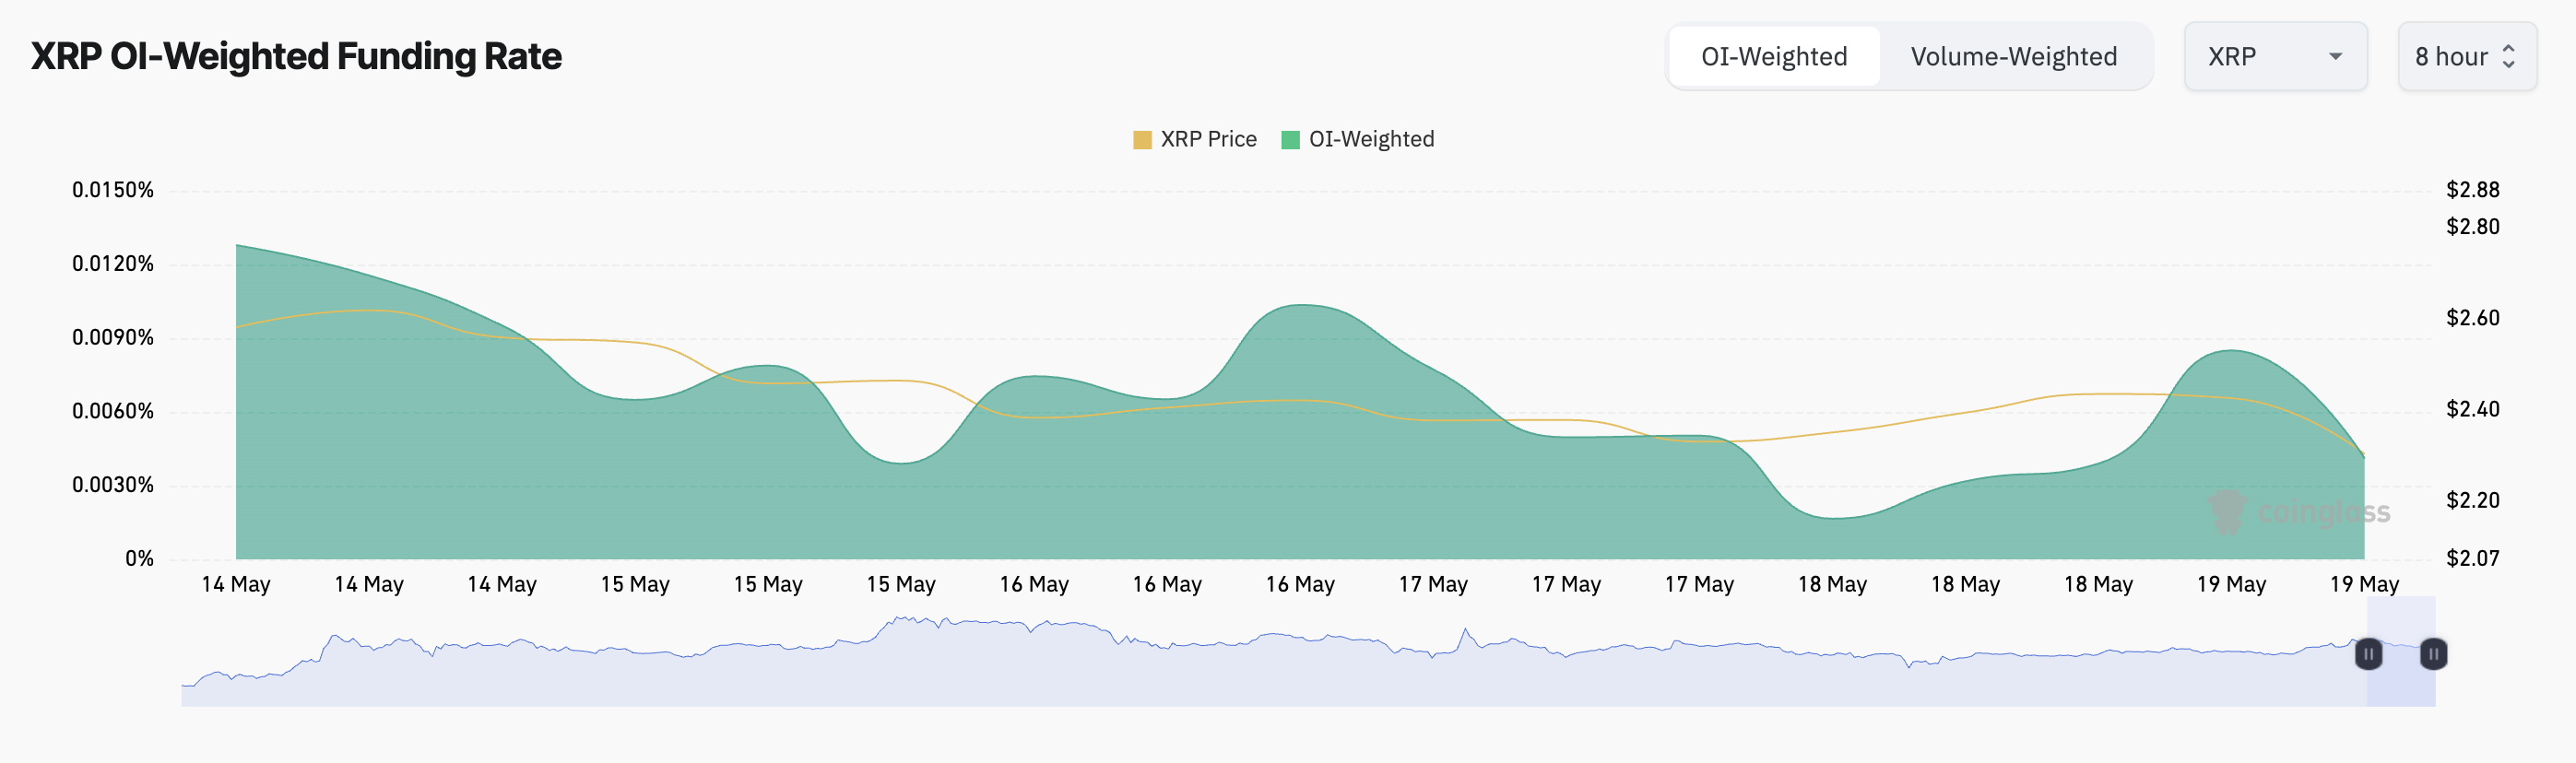 XRP Funding Rate. Source:
Coinglass
XRP Funding Rate. Source:
Coinglass
The funding rate is a periodic payment between traders in perpetual futures contracts to keep the contract price aligned with the spot price. When the funding rate is positive, there is a higher demand for long positions. This means that more traders are betting on XRP’s price going up.
XRP Bulls Take Charge
On the daily chart, XRP’s Directional Movement Index (DMI) highlights the growing demand for the altcoin. At press time, the token’s positive directional index (+DI) rests above the negative directional index (-DI).
The DMI indicator measures the strength of an asset’s price trend. It consists of two lines: the +DI, which represents upward price movement, and the -DI, which means downward price movement.
As with XRP, the market trend is bullish when the +DI rests above the -DI. If this persists, the token’s price could surge to $2.50.
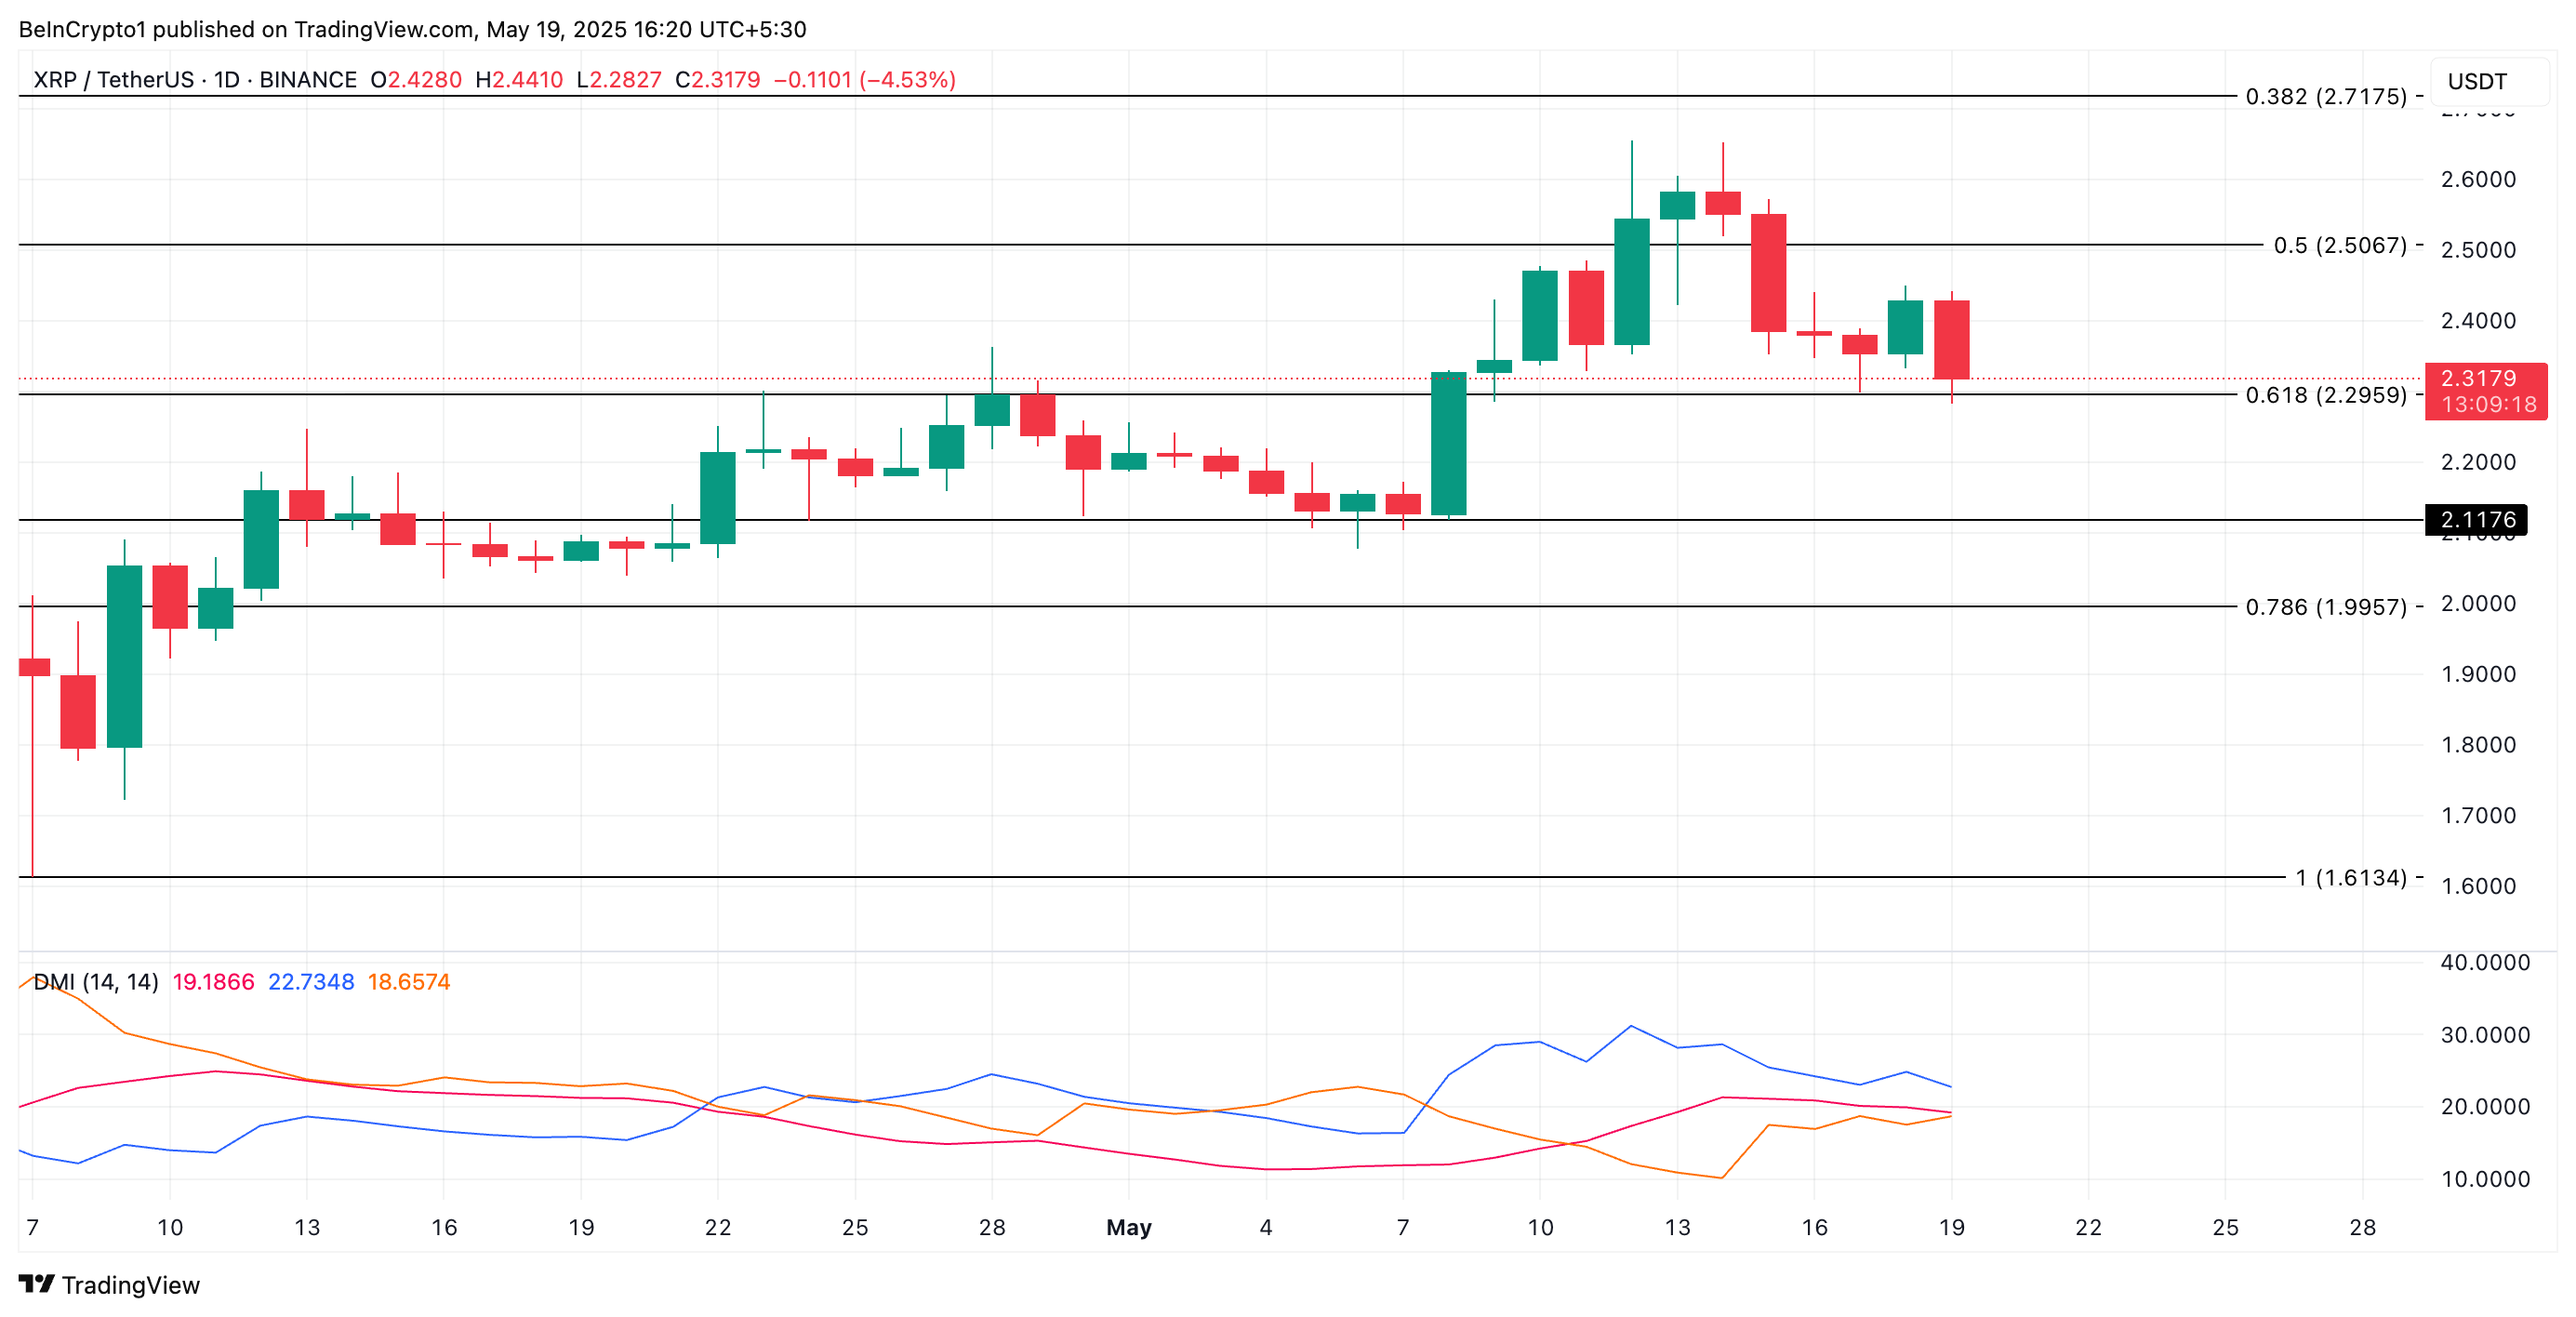 XRP Price Analysis. Source:
TradingView
XRP Price Analysis. Source:
TradingView
However, if the XRP token price drop continues, its value could fall below $2.29, and trend toward $2.11.
Disclaimer: The content of this article solely reflects the author's opinion and does not represent the platform in any capacity. This article is not intended to serve as a reference for making investment decisions.
You may also like
AI and Quantum: Trump's $6 Billion Plan Could Also Impact Bitcoin
Wall Street giants to release financial reports next week: stock trading revenue expected to approach $19 billion, "everyone is a winner" may be a thing of the past
According to analyst expectations compiled by Bloomberg, the combined equity trading revenue of the five major U.S. banks in the third quarter will approach $19 billion, but fixed income trading revenue is expected to drop to its lowest point of the year, and M&A activity has also cooled. Meanwhile, AI-driven cash optimization tools may lead to deposit outflows, sparking concerns about bank stocks in the market. Analysts believe that while the profit performance of each bank may further diverge, market concerns about the impact of AI may be overblown.
EU regulator wants proof tokenized collateral survives a crisis
Ripple Prime’s ETF Push Tests the Rise of Nonbank Financing
Crypto prices
More


