
Shiba Inu (SHIB): Broke Now, Massive Bitcoin (BTC) Jump, XRP: Recipe for $3 Bounce

Short-term holders may face serious repercussions after Shiba Inu (SHIB) recently broke through a crucial support level. SHIB has dropped by almost 3% today and is currently trading at about $0.00001187, well below the crucial technical barrier of $0.00001231, which served as a launching pad for rallies in April and May.
Following several unsuccessful attempts to break above resistance close to the 50-day and 100-day EMAs, which are both presently convergent around $0.0000138-$0.0000140, the market broke through this floor. The asset has sunk so far into bearish territory that the 200-day EMA, which is situated further above at $0.00001546, has remained unchanged for weeks. The volume of this breakdown spike is also concerning because there is not any obvious buying support to intervene, leaving SHIB open to further declines.
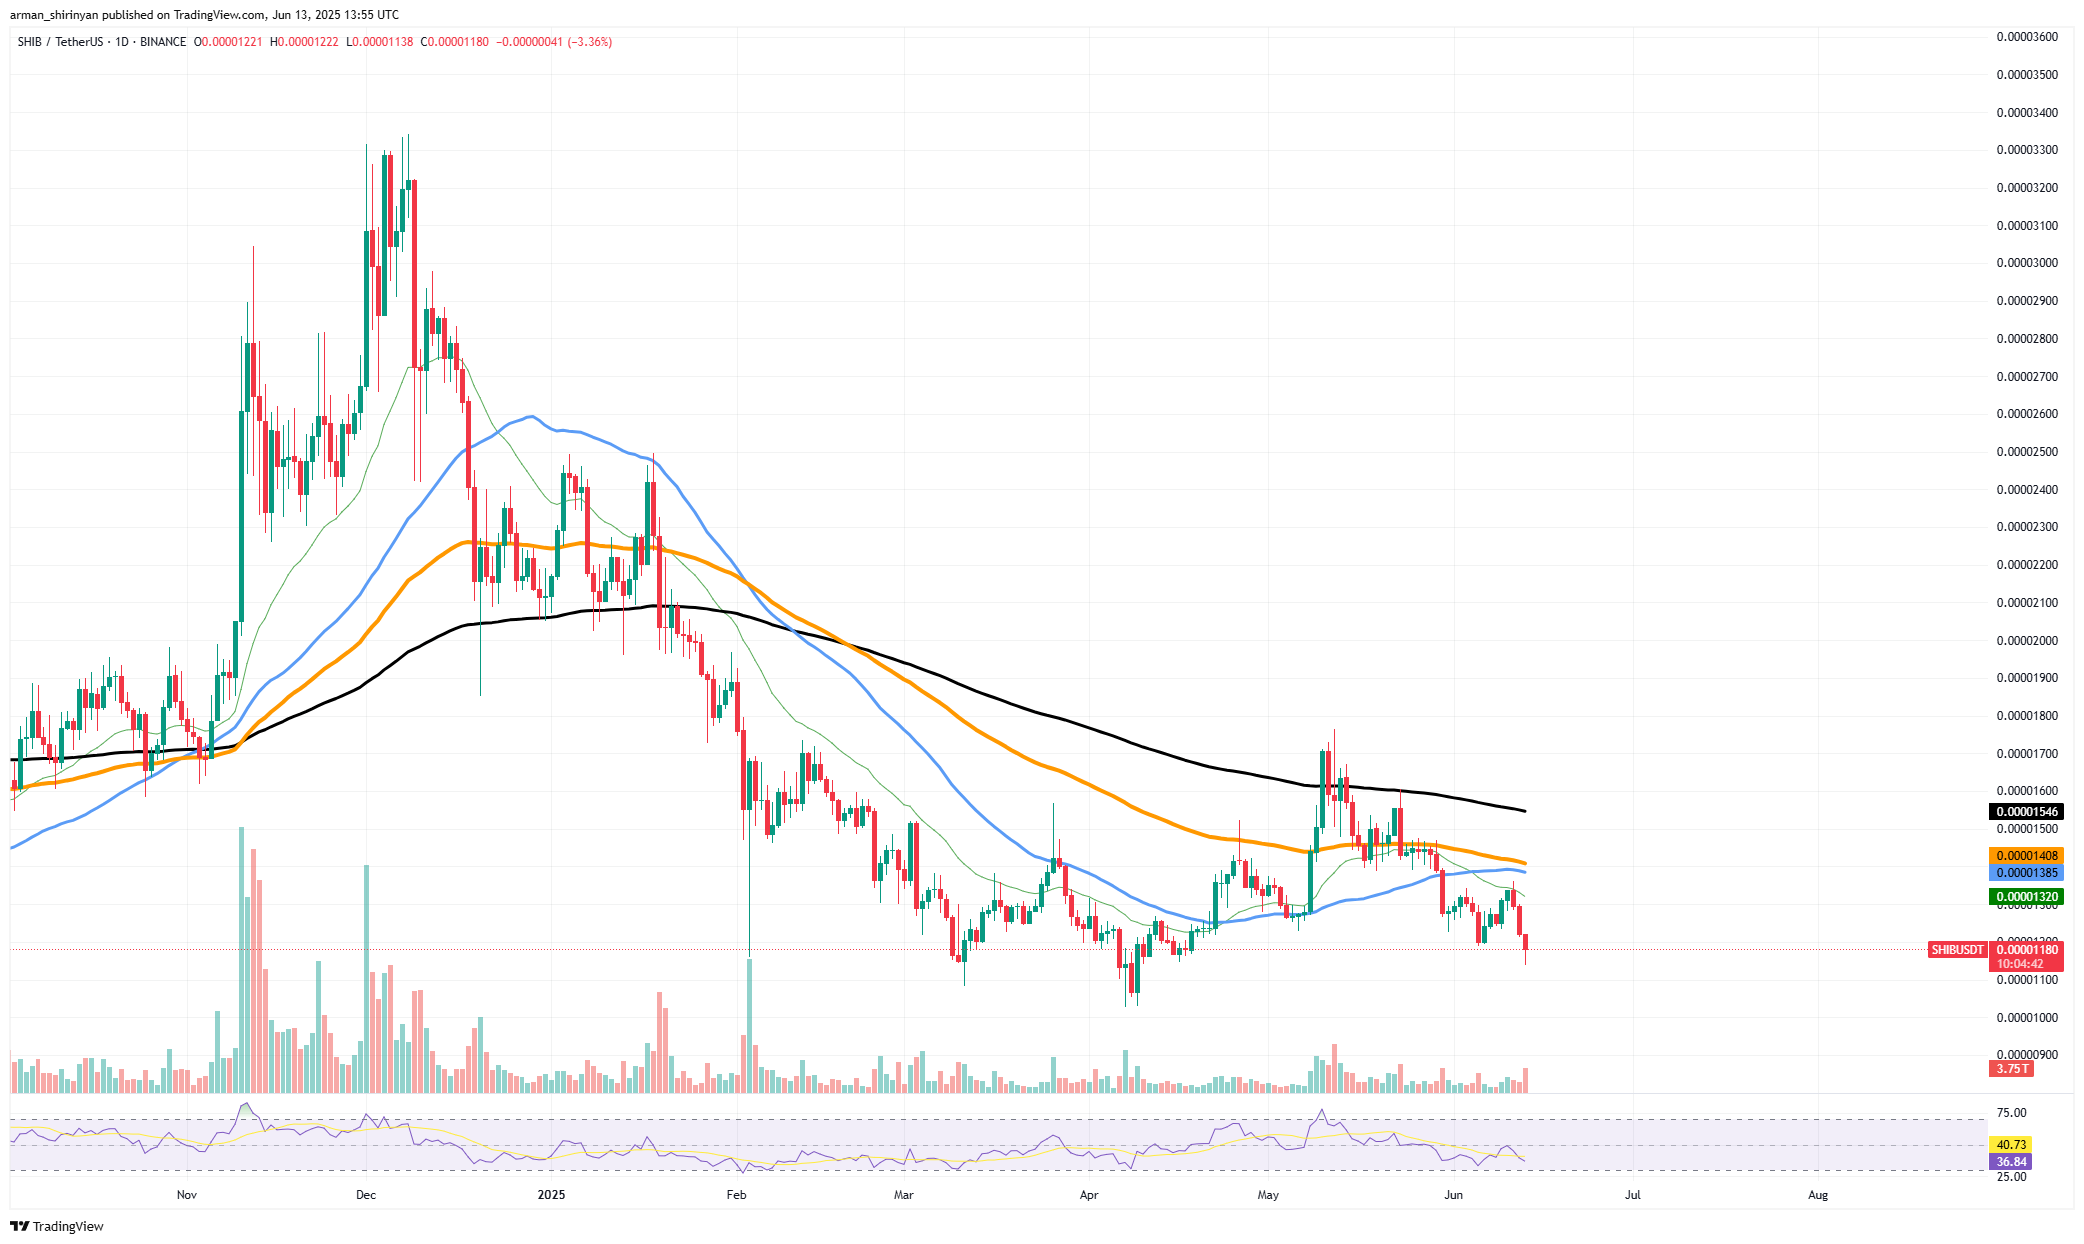
The RSI at 32.79 indicates that the token is almost oversold, but it is too soon to consider this a dip-buying opportunity in the absence of any obvious reversal signals. As of right now, investors should not anticipate a recovery rally unless SHIB can swiftly and heavily retake the $0.0000123 zone.
If not, momentum will probably push the asset lower toward the psychological $0.00001000 level, which is a significant round number and the last line of defense before panic-selling gets worse. The general sentiment of the market exacerbates the situation. In times of declining risk appetite, meme-based assets like SHIB are typically the first to be dumped. It is reasonable to anticipate further declines or at most stagnation unless there is an unexpected catalyst (a burn event, whale movement or integration news, for example).
Bitcoin's direct hit
Following a textbook recovery, all eyes are on what will happen next with Bitcoin (BTC). Directly off the 50-day EMA, Bitcoin experienced a rapid reversal back toward $105,000, following a precipitous decline to $102,816. Such a response at a crucial technical support level indicates the existence of aggressive interest in dip buying as well as potentially algorithmic activity in the vicinity of moving averages.
The action was taken shortly after a significant liquidation cascade that we previously reported on, which consisted of a series of lengthy liquidations that went above and beyond expectations and cleared out overly leveraged positions. As the sell pressure subsided and buyers intervened at support, that aggressive flush set the stage for a countermove. One factor, though, cannot be disregarded: descending volume. The volume did not rise proportionately to the strong candle recovery.
Bulls' lack of conviction could indicate that this is a temporary relief bounce rather than a return to the trend. It makes sense that market participants would be cautious. Although there may still be room to run without crossing overbought territory, the RSI, which is currently at 53.75, indicates that momentum is not as strong as it was when Bitcoin tested its all-time high of $112,000 in early June.
That level is still the main psychological barrier, and a retest might take longer to occur if there is not a clear trigger. In the short term, bulls are likely to keep control if Bitcoin stays above the 50 EMA (~$103,000) and does not fall below $102,000. The 100-day EMA may provide the next line of defense if risk shifts back toward $98,000.
XRP's last chance
Even though XRP is holding onto its last line of defense, bulls may need it to engineer a dramatic reversal. The asset has retreated toward the 200-day moving average, which now serves as a crucial turning point for any possible recovery and is currently trading close to $2.14. Despite recent rejection in the $2.40-2.50 range, XRP has not yet made a clear break.
Moving averages, especially the 50, 100 and 200-day EMAs, are converging and compressing the price into a tight structure, indicating that a high-volatility move may be imminent. Red candles notwithstanding, this consolidation might be a traditional springboard configuration. Since the RSI is still neutral at about 45, neither side has yet to experience severe exhaustion.
A bounce toward $2.60 and ultimately a retest of $3 is still possible if bulls defend the 200 EMA and the price stays above $2.09. But at the moment, bears are gaining momentum. Over the past few sessions, the volume has been decreasing, suggesting that neither side is very convinced. On a red day, if volume increases and XRP closes below the 200 EMA, a steeper sell-off toward $1.85 or less is probably in store.
However, for traders and long-term investors, considering an entry this might be a unique chance. As there is currently no structural breakdown and a slow bleed into key support, the current setup is similar to past XRP price action that has preceded significant reversals.
Disclaimer: The content of this article solely reflects the author's opinion and does not represent the platform in any capacity. This article is not intended to serve as a reference for making investment decisions.
You may also like
The 10-year US Treasury yield approaches 5.4%, with the AI halo unable to hide the "inflated" risks of the S&P 500
Behind the S&P 500's record high, only 30% of its constituent stocks are above their 50-day moving average, marking the narrowest market breadth at a record high since 1990. The Russell 2000 has fallen for five consecutive weeks, and high-yield bond yields have soared to 15%. Societe Generale warns that if US Treasury yields rise to 6% and oil prices reach $150, the S&P 500 could fall by more than 20% next year. In addition, some top-performing fund managers have completely exited AI stocks in favor of energy, stating that once financing dries up, it will be "game over."
Oil tanker freight reaches a sixty-year high: shipping oil from the US to China is more expensive than launching a rocket!
The freight for a single barrel of crude oil has soared to $41, approaching half the oil price, and for a single trip, the freight was once enough to buy an oil tanker. The Middle East crisis has led to a structural shortage of shipping capacity in the Strait of Hormuz, coupled with ship-to-ship transfers extending turnaround times. VLCC freight rates have skyrocketed from an annual average of $9.2 million to $77 million—an increase of more than eight times. Refiners’ profits are being rapidly eroded, the average price of second-hand oil tankers has reached a historic high, and, unusually, surpassed the price of new vessels.

Following the Drop but Not the Rise! Silver Trapped in Difficulties
The logic of AI and solar energy demand continues to play out, yet prices are falling against the trend—macroeconomic forces such as a strengthening US dollar and rising real interest rates have completely suppressed fundamentals. Speculative funds offloaded $1.6 billion in a single week, marking a yearly peak, while CTA net short positions reversed by $2.6 billion to the highest level this year. However, Goldman Sachs analysts believe that the extreme short positioning itself is building reversal momentum, highlighting an asymmetry; once macro headwinds subside, a retaliatory rebound could be easily triggered. After a similar shakeout last time, silver surged 15% in six weeks.
Crypto prices
More


