
Ethereum Price Eyes Recovery—Can ETH Kick Off a Fresh Upside Move?

Ethereum price started a fresh decline and tested the $2,450 zone. ETH is now correcting losses and might aim for a move above the $2,620 resistance.
- Ethereum started a fresh decline below the $2,750 level.
- The price is trading near $2,575 and the 100-hourly Simple Moving Average.
- There was a break above a contracting triangle with resistance at $2,550 on the hourly chart of ETH/USD (data feed via Kraken).
- The pair could start a fresh increase if it clears the $2,620 zone in the near term.
Ethereum Price Corrects Losses
Ethereum price started a fresh decline below the $2,750 and $2,620 levels, like Bitcoin. ETH price even traded below the $2,500 level and tested $2,440.
A low was formed at $2,441 and the price recently started a recovery wave. There was a move above the $2,500 and $2,520 levels. The price surpassed the 23.6% Fib retracement level of the downward move from the $2,880 swing high to the $2,441 low.
Besides, there was a break above a contracting triangle with resistance at $2,550 on the hourly chart of ETH/USD. Ethereum price is now trading near $2,575 and the 100-hourly Simple Moving Average.
On the upside, the price could face resistance near the $2,585 level. The next key resistance is near the $2,620 level. The first major resistance is near the $2,660 level. It is near the 50% Fib retracement level of the downward move from the $2,880 swing high to the $2,441 low.
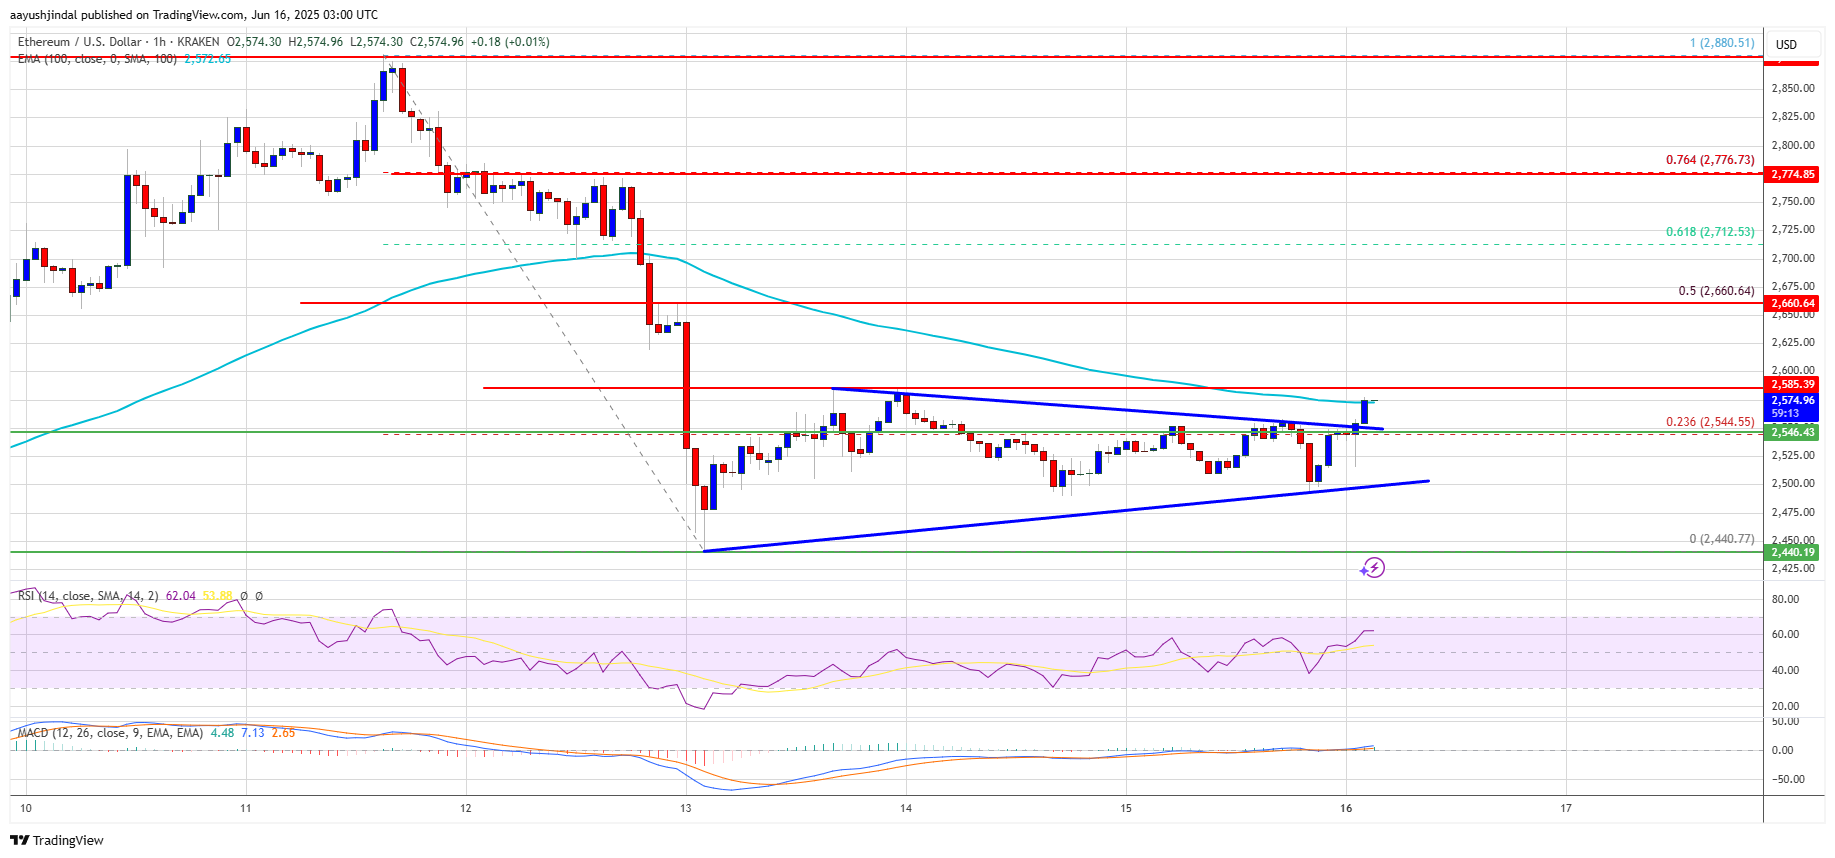
A clear move above the $2,660 resistance might send the price toward the $2,720 resistance. An upside break above the $2,720 resistance might call for more gains in the coming sessions. In the stated case, Ether could rise toward the $2,800 resistance zone or even $2,880 in the near term.
Another Decline In ETH?
If Ethereum fails to clear the $2,620 resistance, it could start a fresh decline. Initial support on the downside is near the $2,540 level. The first major support sits near the $2,500 zone.
A clear move below the $2,500 support might push the price toward the $2,440 support. Any more losses might send the price toward the $2,420 support level in the near term. The next key support sits at $2,350.
Technical Indicators
Hourly MACD – The MACD for ETH/USD is gaining momentum in the bullish zone.
Hourly RSI – The RSI for ETH/USD is now above the 50 zone.
Major Support Level – $2,500
Major Resistance Level – $2,620
Disclaimer: The content of this article solely reflects the author's opinion and does not represent the platform in any capacity. This article is not intended to serve as a reference for making investment decisions.
You may also like
The "Digital Metrics Game" Behind the Trillion-Dollar Valuation: OpenAI and Anthropic's Revenues Are Actually Incomparable
Anthropic counts "total revenue" in its cloud sales, while OpenAI only recognizes the "net revenue" based on profit-sharing. This discrepancy in accounting standards has directly triggered a decline in tech stocks. Even more striking, the highly touted "annualized revenue" is significantly inflated, with OpenAI's actual revenue expected to be only half of this figure. Anthropic's actual revenue also exhibits nearly a 50% gap compared to its reported numbers.
Meanwhile raises $37.5 million as Bitcoin life insurance demand rises abroad
Nvidia quietly redefines free cash flow, is there something fishy in the $100 billion buyback plan?
Nvidia has classified its equity investments in 242 companies, including OpenAI and Anthropic, as "strategic use" and deducted them from its free cash flow. After this adjustment, free cash flow for the first half of the fiscal year plummeted from the official figure of $69.9 billion to $21.7 billion, a decrease of nearly 70%. Meanwhile, the company added $24.9 billion in long-term debt to support buybacks, casting doubt on the sustainability of its $235 billion buyback plan.
NEAR, XRP, SHIB and BTC retreat from key levels, bulls target new highs
Crypto prices
More


