Bitget App
Trade smarter
Buy cryptoMarketsTradeFuturesStocksEarnInstitutionAI & More
Pendle (PENDLE) To Rise Ahead? Key Emerging Pattern Suggests Potential Upside Move

Pendle (PENDLE) To Rise Ahead? Key Emerging Pattern Suggests Potential Upside Move

CoinsProbeCoinsProbe2025/06/16 22:16
By:Nilesh Hembade

Date: Mon, June 16, 2025 | 06:16 PM GMT

The cryptocurrency market is making a strong comeback this week after suffering from volatility sparked by geopolitical tensions between Israel and Iran. Ethereum (ETH) has risen 3% to reclaim the $2,625 mark, and this broader market rebound is pulling several altcoins into the green — including Pendle (PENDLE).

The DeFi-focused token has posted impressive 9% gains today. Even more interestingly, its chart is signaling the emergence of a well-known “Power of 3” pattern — a possible precursor to a strong bullish continuation.

Pendle (PENDLE) To Rise Ahead? Key Emerging Pattern Suggests Potential Upside Move image 0 Source: Coinmarketcap

Power of 3 Pattern in Play

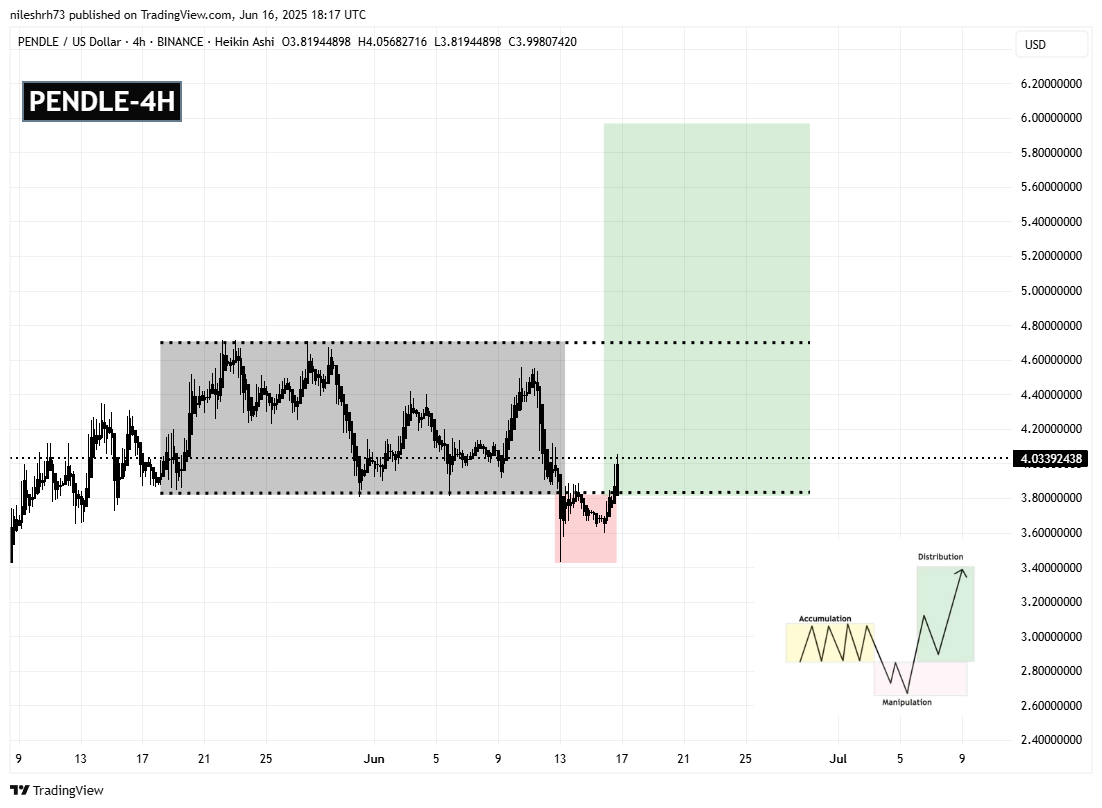
On the 4-hour chart, PENDLE appears to be forming the classic Power of 3 market structure, a technical concept closely associated with institutional “smart money” behavior. This pattern unfolds in three distinct phases:

Accumulation Phase

Between May 18 and June 13, PENDLE moved sideways within a narrow range between $4.69 and $3.83. This quiet period, characterized by low volatility and minimal directional bias, is often where institutions quietly accumulate their positions without tipping off retail traders. The range is visible as a rectangular zone on the chart.
Pendle (PENDLE) To Rise Ahead? Key Emerging Pattern Suggests Potential Upside Move image 1 PENDLE 4H Chart/Coinsprobe (Source: Tradingview)

Manipulation Phase

On June 13, the price broke sharply below the range support, dropping to a low of $3.42. This sudden drop likely triggered stop-losses and caused panic selling — a classic “manipulation” move aimed at flushing out weak hands before the real rally begins.

Expansion Phase

Immediately after bottoming out, PENDLE rebounded aggressively, reclaiming the key $3.83 level and pushing higher. This bounce marks the beginning of the Expansion Phase, where price moves sharply in the true direction of the trend. PENDLE is now testing the $4.69 resistance level, previously the top of the accumulation zone.

What’s Next for PENDLE?

If the token breaks and holds above $4.69, it would validate the breakout from the Power of 3 pattern and signal a continuation of the bullish trend. In this scenario, the next technical target sits near $5.96, a level derived from the height of the accumulation zone projected upward — indicating a potential 47% rally from the breakout point.

Overall, PEDNLE’s chart is showing early signs of a rebound, backed by a textbook setup. While global tensions remain a wildcard that could override technical patterns, the short-term outlook looks promising.

Disclaimer: This article is for informational purposes only and not financial advice. Always conduct your own research before investing in cryptocurrencies.


0
0

Disclaimer: The content of this article solely reflects the author's opinion and does not represent the platform in any capacity. This article is not intended to serve as a reference for making investment decisions.

Understand the market, then trade.
Bitget offers one-stop trading for cryptocurrencies, stocks, and gold.
Trade now!

You may also like

The 10-year US Treasury yield approaches 5.4%, with the AI halo unable to hide the "inflated" risks of the S&P 500

Behind the S&P 500's record high, only 30% of its constituent stocks are above their 50-day moving average, marking the narrowest market breadth at a record high since 1990. The Russell 2000 has fallen for five consecutive weeks, and high-yield bond yields have soared to 15%. Societe Generale warns that if US Treasury yields rise to 6% and oil prices reach $150, the S&P 500 could fall by more than 20% next year. In addition, some top-performing fund managers have completely exited AI stocks in favor of energy, stating that once financing dries up, it will be "game over."

华尔街见闻•2026/10/10 04:01

Oil tanker freight reaches a sixty-year high: shipping oil from the US to China is more expensive than launching a rocket!

The freight for a single barrel of crude oil has soared to $41, approaching half the oil price, and for a single trip, the freight was once enough to buy an oil tanker. The Middle East crisis has led to a structural shortage of shipping capacity in the Strait of Hormuz, coupled with ship-to-ship transfers extending turnaround times. VLCC freight rates have skyrocketed from an annual average of $9.2 million to $77 million—an increase of more than eight times. Refiners’ profits are being rapidly eroded, the average price of second-hand oil tankers has reached a historic high, and, unusually, surpassed the price of new vessels.

华尔街见闻•2026/10/10 03:16
Oil tanker freight reaches a sixty-year high: shipping oil from the US to China is more expensive than launching a rocket!

Following the Drop but Not the Rise! Silver Trapped in Difficulties

The logic of AI and solar energy demand continues to play out, yet prices are falling against the trend—macroeconomic forces such as a strengthening US dollar and rising real interest rates have completely suppressed fundamentals. Speculative funds offloaded $1.6 billion in a single week, marking a yearly peak, while CTA net short positions reversed by $2.6 billion to the highest level this year. However, Goldman Sachs analysts believe that the extreme short positioning itself is building reversal momentum, highlighting an asymmetry; once macro headwinds subside, a retaliatory rebound could be easily triggered. After a similar shakeout last time, silver surged 15% in six weeks.

华尔街见闻•2026/10/10 02:21