
Bitcoin ETF Demand Rises, but Price Stalls — What’s Behind the Disconnect?

Bitcoin's lackluster price performance despite significant ETF inflows has raised questions about potential selling from long-term holders and external geopolitical factors.
Over the past eight weeks, Bitcoin (BTC) absorbed more than $11.2 billion in ETF (exchange-traded fund) inflows. However, its price has risen only about 10%, far less than many investors expected.
The mismatch between capital inflows and price performance has triggered a wave of concern and speculation, reviving memories of BlackRock-Coinbase custody scrutiny.
Bitcoin’s Tepid Response to ETF Inflows
In a recent post, Matrixport highlighted the mismatch between the BTC price and inflows into spot Bitcoin ETFs over the past eight weeks.
“Bitcoin ETFs keep buying — but why isn’t the price surging?” the firm noted.
Despite sustained demand from institutional vehicles, Bitcoin’s sluggish response implies that other forces may offset the inflows. The latest 10x Research report echoes that sentiment.
In a new report on Thursday, 10X researchers warned of significant, yet largely invisible, selling that may be flowing from long-term holders or early investors.
Why Bitcoin Isn’t Rallying—Even After $12 Billion in InflowsWhy this report mattersBitcoin has absorbed over $24 billion in demand since mid-April—yet price action has stalled. Something beneath the surface is offsetting those inflows, and few are talking about it. While… pic.twitter.com/cgm7JVy5vz
— 10x Research (@10x_Research) June 19, 2025
The subdued reaction has also raised questions about the behavior of high-profile corporate buyers like MicroStrategy (now Strategy).
MicroStrategy’s current accumulation pace appears more restrained than its more aggressive purchasing after Donald Trump’s election. This suggests a cautious or distribution-heavy market environment.
“Notice how each time they buy, the position amount shrinks drastically (avg, -52%),” financial analyst and Whalewire CEO Jacob King said recently.
Meanwhile, the mismatch between Bitcoin ETF inflows and the associated BTC price reaction refreshes concerns about “paper BTC.”
In September 2024, BlackRock filed to amend its spot Bitcoin ETF (IBIT) amid concerns over Coinbase’s custodial practices.
At the time, some investors feared that ETF issuers were being settled with IOUs rather than real BTC, undermining price discovery.
Coinbase CEO Brian Armstrong denied the claims and said all ETF-related transactions are settled on-chain within one business day.
Similarly, Bloomberg’s ETF analyst slammed the speculation, refuting the rumor that Coinbase was writing Bitcoin IOUs for BlackRock and suppressing prices.
The analyst attributed the lack of correlation between BTC ETF inflows and Bitcoin price to selling pressure among native Bitcoin holders rather than ETF issuers or BlackRock.
Balchunas lauded the issuers for actually stabilizing the market.
I get why these theories exist and ppl want to scepegoat the ETFs. Bc it is too unthinkable that the native HODLers could be the sellers. But they are. The call is coming from inside the house. All the ETFs and BlackRock have done is save btc’s price from the abyss repeatedly.
— Eric Balchunas (@EricBalchunas) September 14, 2024
Notwithstanding, the speculation has resurfaced amid the current Bitcoin price stagnation.
Macro Uncertainty Clouds Sentiment
Meanwhile, geopolitical instability may also be weighing on price momentum, particularly the tension between Israel and Iran, with the US now taking a position.
According to Santiment, the ongoing conflict between Israel and Iran has led to a visible increase in volatility across crypto. Between June 12 and 15, bearish sentiment surged, wiping out over $200 billion from the total crypto market cap.
Bitcoin dropped 4–6% before stabilizing near $105,000. Santiment analysts say this pattern is reminiscent of previous geopolitical shocks like Russia’s invasion of Ukraine or the October 2022 Israel-Palestine conflict.
“Despite the initial panic, Bitcoin has remained in the $104,000 to $105,000 range, aided by consistent ETF inflows and a lack of follow-through in military actions, mirroring the typical ‘risk-off, then stabilize’ pattern seen in previous geopolitical crises,” Santiment said in a post.
Despite persistent ETF inflows and steady on-chain fundamentals, traders are hesitant. Volatility is compressing, and liquidity appears thin beneath the surface.
According to 10x Research, traders bet on a breakout or brace for a breakdown.
In essence, the Bitcoin price action may now reflect a deeper structural tension. There is a clash between bullish flows from institutions, cautious re-entry from sidelined retail, and strategic selling from long-time holders.
Until that imbalance resolves and confidence in the price formation returns, Bitcoin may defy the inflow narrative.
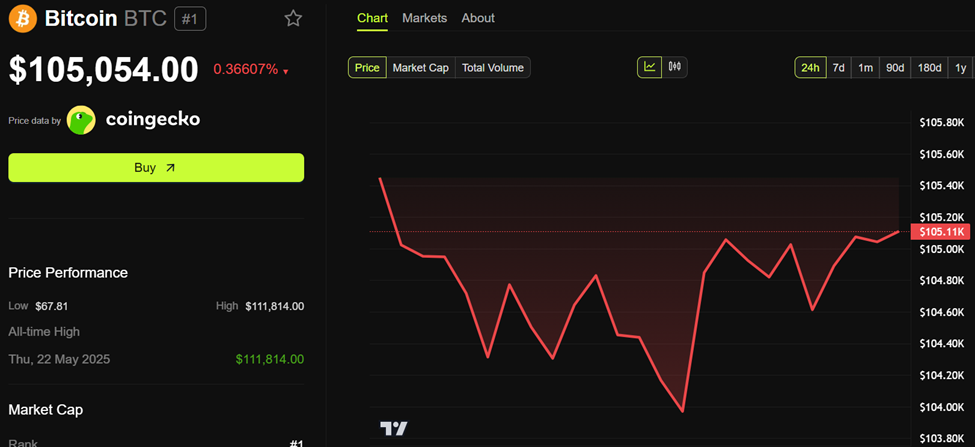 Bitcoin (BTC) Price Performance. Source:
BeInCrypto
Bitcoin (BTC) Price Performance. Source:
BeInCrypto
BeInCrypto data shows BTC was trading for $105,054 as of this writing, down by 0.36% in the last 24 hours.
Disclaimer: The content of this article solely reflects the author's opinion and does not represent the platform in any capacity. This article is not intended to serve as a reference for making investment decisions.
You may also like
XRP Weekly Chart Blue Lines Point to These Long-Term Price Targets

The 10-year US Treasury yield approaches 5.4%, with the AI halo unable to hide the "inflated" risks of the S&P 500
Behind the S&P 500's record high, only 30% of its constituent stocks are above their 50-day moving average, marking the narrowest market breadth at a record high since 1990. The Russell 2000 has fallen for five consecutive weeks, and high-yield bond yields have soared to 15%. Societe Generale warns that if US Treasury yields rise to 6% and oil prices reach $150, the S&P 500 could fall by more than 20% next year. In addition, some top-performing fund managers have completely exited AI stocks in favor of energy, stating that once financing dries up, it will be "game over."
Oil tanker freight reaches a sixty-year high: shipping oil from the US to China is more expensive than launching a rocket!
The freight for a single barrel of crude oil has soared to $41, approaching half the oil price, and for a single trip, the freight was once enough to buy an oil tanker. The Middle East crisis has led to a structural shortage of shipping capacity in the Strait of Hormuz, coupled with ship-to-ship transfers extending turnaround times. VLCC freight rates have skyrocketed from an annual average of $9.2 million to $77 million—an increase of more than eight times. Refiners’ profits are being rapidly eroded, the average price of second-hand oil tankers has reached a historic high, and, unusually, surpassed the price of new vessels.

Following the Drop but Not the Rise! Silver Trapped in Difficulties
The logic of AI and solar energy demand continues to play out, yet prices are falling against the trend—macroeconomic forces such as a strengthening US dollar and rising real interest rates have completely suppressed fundamentals. Speculative funds offloaded $1.6 billion in a single week, marking a yearly peak, while CTA net short positions reversed by $2.6 billion to the highest level this year. However, Goldman Sachs analysts believe that the extreme short positioning itself is building reversal momentum, highlighting an asymmetry; once macro headwinds subside, a retaliatory rebound could be easily triggered. After a similar shakeout last time, silver surged 15% in six weeks.
Crypto prices
More


