- VET breaks 50-day downtrend with confirmed double bottom on daily chart.
- Support holds at $0.02424, with resistance capped at $0.02572 in the current range.
- Chart setup projects 15%–20% upside if structure holds above $0.02225.
VeChain (VET) has shown renewed upward movement following a confirmed breakout from a multi-week downtrend. The digital asset’s price rose to $0.02507 , posting a 3.2% gain in the past 24 hours. This upward action follows a technical structure marked by a double bottom pattern on the daily timeframe. Traders have turned their attention to this setup due to its historical relevance and strong follow-through during similar past events.
The breakout occurred after VET tested the $0.0200 level twice, forming a well-defined base. Price now sits near immediate resistance at $0.02572, while holding support above $0.02424. Historical data shows that the last time VET formed this pattern, it delivered a rally exceeding 150% within days. Market participants are monitoring similar conditions in anticipation of increased volatility.
Daily Chart Forms Double Bottom with Downtrend Breakout
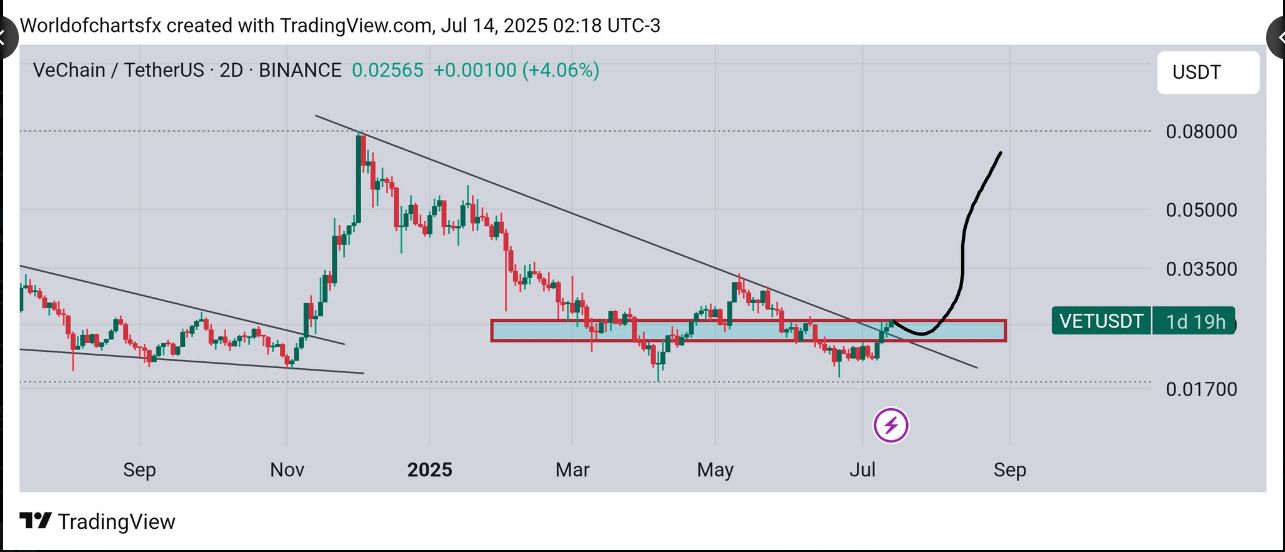
On the 2-day graph, VeChain has broken above a downtrend line that ran for more than 50 trading periods. The breakout was also seen alongside a double bottom formation since the two lows took place at about the $0.0200 level. This area now acts as a critical support level, helping to anchor the current move.
 Source: (X)
The breakout retest appears to be holding with price slowly building momentum. It is easy to identify an area of consolidation between $0.02225 and $0.02424. Note that a daily candle close above $0.02225 was previously an indicator of an important trigger zone, aligning well with the recent breakout.
With the breakout now confirmed and the structure intact, focus has shifted to near-term price objectives of $0.03000 to $0.03500. These are derived from the previous swing move and measured breakout zone.
Volume Build-Up Suggests Short-Term Upside Pressure
VeChain’s trading activity has picked up with the breakout, suggesting rising market interest around current levels. Though volume data remains moderate, the continued price climb implies follow-through is underway. Resistance at $0.02572 remains in focus, as a close above this level would open the way to higher targets.
At the same time, support near $0.02424 provides a base for this move. Traders consider it a key validation level for maintaining the trend’s integrity. Historical chart behavior shows that a breach above resistance tends to trigger swing rallies, especially if momentum holds beyond consolidation.
Based on technical measurements, a 15% to 20% price increase may be in play if current support remains intact. This expectation comes from previous moves observed under similar chart setups.
Key Levels and Market Structure Underpin Recovery Potential
As of now, VeChain trades at $0.02565 and holds just under major resistance. Price activity remains within the 24-hour range of $0.02424 to $0.02572. The structure favors a bullish continuation, though confirmation above resistance is required.
The consolidation zone built over the last three weeks serves as the accumulation range. A clean breakout from this area has led to price recovery. The curved trajectory shown in the current chart suggests a projected move toward the $0.03500–$0.07000 zone. However, immediate focus remains on holding above $0.02424 for bullish structure to remain valid.
Market attention will likely remain centered on whether the double bottom and trendline breakout sustain higher timeframe support across coming sessions.