

Date: Sun, July 20, 2025 | 09:54 AM GMT
The broader cryptocurrency market continues to ride a bullish wave, led by Ethereum (ETH), which has surged 25% over the past week and is now trading above $3,700. This surge in market sentiment is spilling over into promising altcoins — and Raydium (RAY) is showing signs of further upside.
RAY has posted a 4% gain in the last 24 hours, pushing its 30-day rally to 36%, and now trades near $2.88. But beyond the numbers, a developing harmonic structure on the daily chart — a setup suggesting that the token have more room to run.
 Source: Coinmarketcap
Harmonic Pattern Hints at Bullish Continuation
On the daily timeframe, RAY is currently developing a Bearish ABCD harmonic pattern — a setup that, despite its name, includes a strong bullish CD leg as part of the final move before a potential reversal.
The pattern initiated at Point A (near $0.84), moved upward to Point B, retraced to Point C around $1.73, and is now advancing toward Point D. As seen on the chart, RAY is mid-way through this CD leg, signaling the most explosive part of the move.
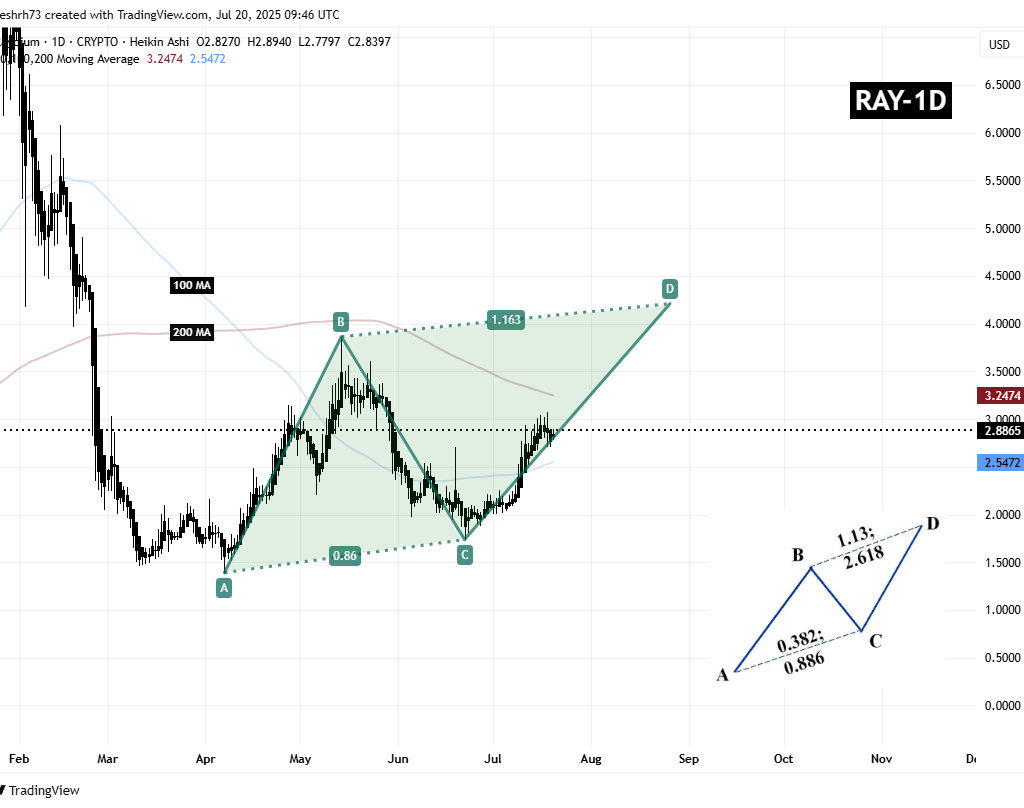 Raydium (RAY) Daily Chart/Coinsprobe (Source: Tradingview)
RAY is also approaching a key technical resistance zone — the 200-day moving average at ~$3.24. Clearing this level could confirm bullish strength and open the door for a continued rally.
What’s Next for RAY?
If the CD leg plays out as expected and RAY breaks above the 200-day MA, the next upside target lies at the Potential Reversal Zone (PRZ) — the 1.16 Fibonacci extension of the BC leg — which projects a move towards $4.20. That’s a 45% upside from the current price and aligns closely with the symmetry of the AB leg, as shown in the harmonic diagram.
However, RAY must maintain support above the 100-day moving average, which currently provides a soft floor for the uptrend. A breakdown below this area could invalidate the pattern and put short-term bulls on the defensive


