
Bitcoin Cash Price Surges Past $570 as Whale Accumulation Hits Monthly High

Key Notes
- Whale investors accumulated 66,040 BCH on Tuesday, marking the highest single-day inflow since early July's peak activity.
- Technical indicators show BCH trading near upper Bollinger Band resistance at $587, with potential targets at $615 if momentum sustains.
- Ethereum profit-taking is driving capital rotation into mid-cap altcoins like Bitcoin Cash, supporting continued upward pressure.
Bitcoin Cash BCH $568.0 24h volatility: 0.8% Market cap: $11.30 B Vol. 24h: $288.80 M price surged past the $570 level on Wednesday, emerging as one of the few top 20 ranked altcoins posting intraday gains. This bullish breakout aligns closely with renewed whale interest, signaling potential institutional accumulation.
IntoTheBlock’s Large Holder Netflow metric tracks the net daily movement of coins into or out of wallets controlling at least 1% of the circulating supply. According to the latest data, Bitcoin Cash whales recorded a net inflow of 66,040 BCH on Tuesday. This marks the largest single-day whale accumulation since the monthly high of 103,520 BCH on July 4.
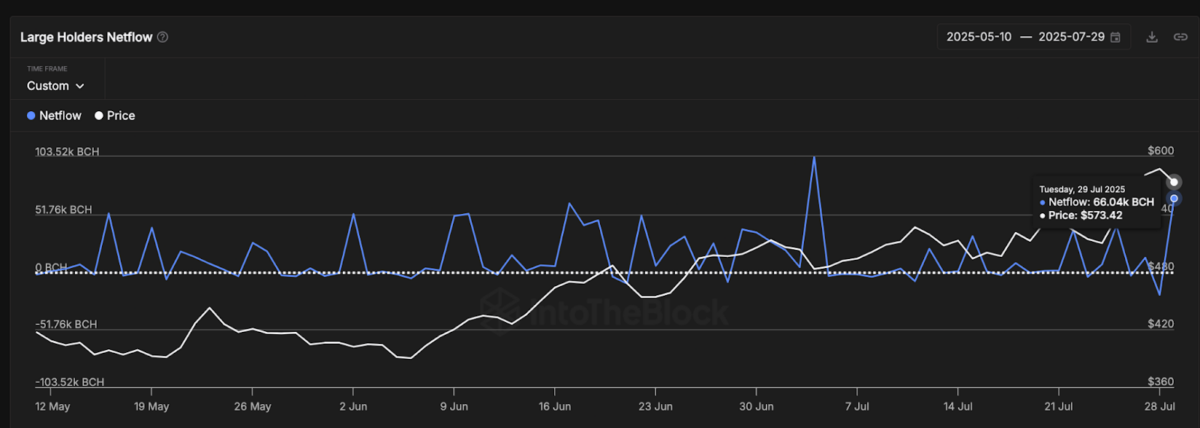
Bitcoin Cash Large Holders’ Netflow | Source: IntoTheBlock, July 30
Notably, BCH price has steadily climbed from $483 to $571~~,~~ since the July 4 buying spree, validating the positive correlation between whale accumulation and BCH price action. Based on historical trends, the latest uptick in whale inflows could signal the early stages of another rally as Bitcoin Cash prepares for potential bullish momentum in August.
However, market watchers are still evaluating whether this momentum can sustain above the $570 zone, or if a rejection at the $600 resistance may trigger a prolonged correction phase.
BCH Price Prediction: $600 Resistance in Focus as Whale Demand Heats Up
From a technical analysis standpoint, Bitcoin Cash continues to trade above the 20-day moving average ($530.70), with the price currently at $571.34, reflecting a 1.28% uptick on Wednesday.
The Bollinger Bands show that BCH is now trading close to the upper band at $587.10, which has seen multiple rejections last week. A clean breakout and close above $587 could open the path toward retesting the $610 psychological resistance level, last seen in early March 2024.
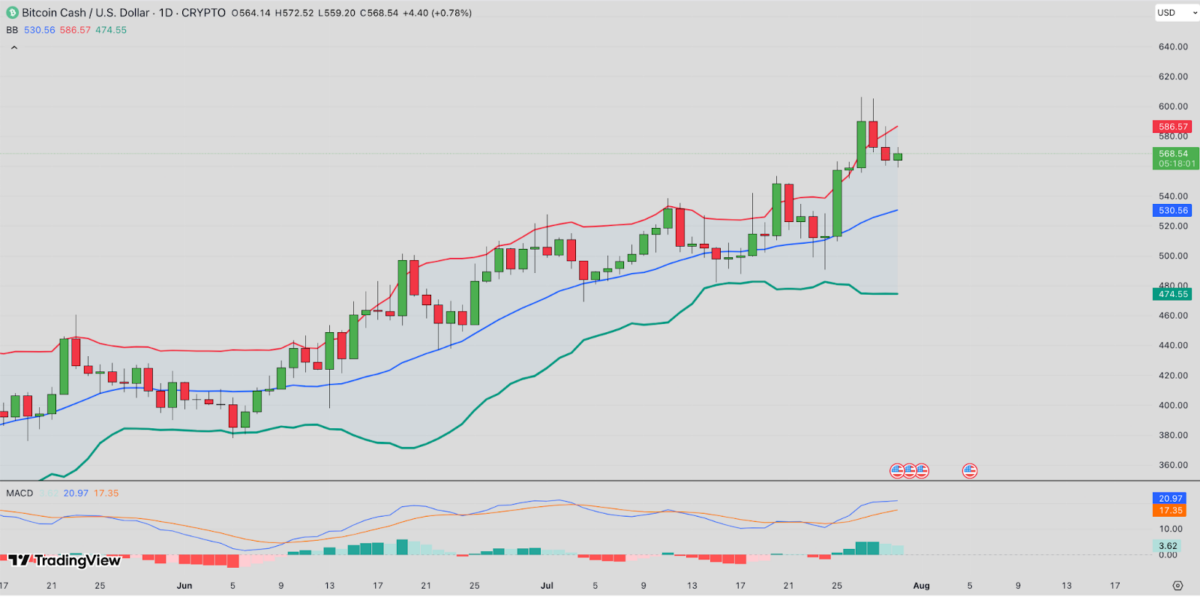
Bitcoin Cash Price Forecast | BCHUSD 24H Chart | TradingView
Meanwhile, the MACD line (21.20) remains above the signal line (17.40), confirming bullish momentum. The histogram bars are still green, though slightly declining, hinting that buying pressure could face exhaustion if $587 proves too strong to overcome this week.
If BCH holds above the $560 support and reclaims the $580-$587 resistance band, bulls may target $615 in early August. Conversely, a dip below the 20-day MA at $530 would invalidate this breakout and potentially expose the BCH price to a correction toward the $510 zone.
Disclaimer: The content of this article solely reflects the author's opinion and does not represent the platform in any capacity. This article is not intended to serve as a reference for making investment decisions.
You may also like
Ahead of Earnings Report, Bank of America Raises Target Price for TSMC: 2nm Capacity Ramp-Up Boosts Sales Expectations and Profit Margins
Ahead of TSMC’s Q3 earnings report, Bank of America Merrill Lynch raised its US stock target price to $620 and maintained a Buy rating. Q3 revenue is expected to exceed the upper end of guidance, with the proportion of 2nm process rising from 3% to 11% in a single quarter, becoming the biggest highlight. Q4 sales are expected to increase by another 11% quarter-on-quarter, targeting a full-year growth rate of 40%. The current stock price corresponds to a forward P/E ratio of 16, which is still at the historical median. Bank of America believes the valuation is “not demanding,” implying approximately 37% upside to the target price.
AI trading cools down and storage chip competition intensifies, Korean stocks plunge over 5%, marking a second consecutive day of sharp decline; SK Hynix drops nearly 8%
On Tuesday, the Korea Composite Stock Index (KOSPI) dropped by as much as 5.1%, triggering the Sidecar circuit breaker mechanism on the exchange and suspending programmatic sell orders for five minutes. Both Samsung Electronics and SK Hynix fell more than 6%, marking five consecutive days of decline. Japan's SoftBank Group plunged over 8%, while AI industry-related stocks such as Tokyo Electron and Advantest also dropped by more than 5%.
Wall Street giants' financial reports tonight: With stock prices trapped in technical correction, even a 20% profit increase can hardly ease triple anxiety
Shares of major US banks hovered in a technical correction zone on Tuesday as the earnings season kicked off, with long-term borrowing costs rising to their highest levels in decades. This has heightened market attention on bank executives’ assessments of US consumer health and credit prospects.
UBS Earnings Season Preview: Strong Momentum from AI Spending, Favoring Lam Research (LRCX.US) and Texas Instruments (TXN.US), Remaining Cautious on Western Digital (WDC.US)
Lam Research (LRCX.US), Texas Instruments (TXN.US), and Western Digital (WDC.US) are set to release their quarterly earnings reports in the coming days. UBS believes that, with continued high spending on artificial intelligence, all three companies are likely to benefit from this trend.
Crypto prices
More


