Dogecoin is currently trading near $0.22140, showing bearish momentum confirmed by RSI at 42.20 and a MACD bearish crossover, with key resistance at $0.225 and support at $0.217.
-
Dogecoin’s price dropped from $0.24400 to a recent low of $0.21734, indicating sustained selling pressure.
-
Technical indicators such as RSI and MACD confirm weakening momentum and potential for further declines.
-
COINOTAG analysis highlights critical resistance at $0.225 and the necessity to hold $0.217 to prevent deeper corrections.
Dogecoin trades near $0.22140 with bearish momentum; monitor resistance at $0.225 and support at $0.217 for potential price shifts. Stay informed with COINOTAG.
Dogecoin Price Faces Continued Bearish Pressure Amid Technical Weakness
Dogecoin (DOGE) is trading in a narrow range between $0.217 and $0.225 as bearish momentum dominates. After falling from $0.24400, the price reached a recent low of $0.21734 on July 30, 2025. Bearish price action is reinforced by repeated lower highs and lower lows on the 4-hour chart, signaling ongoing selling pressure.
Short-Term Bounce Possible but Market Remains Under Pressure
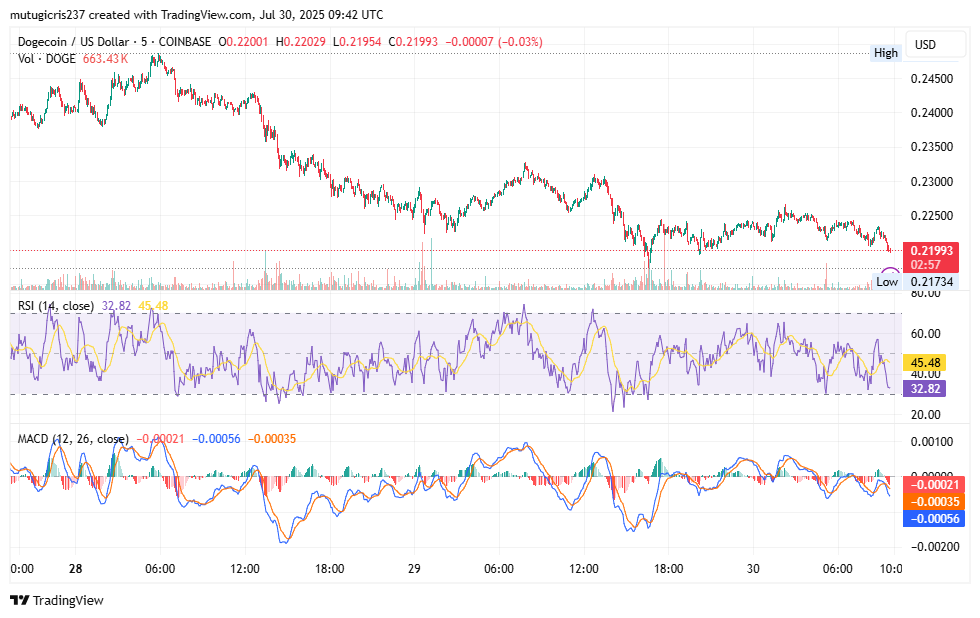
Although the TD Sequential “9” candle and reversal arrow suggest a potential short-term rebound, the overall market sentiment remains cautious. Resistance between $0.22600 and $0.22800 continues to cap upward moves, limiting bullish momentum. Volume patterns on the 5-minute chart show stronger selling activity during declines, confirming sellers’ dominance.

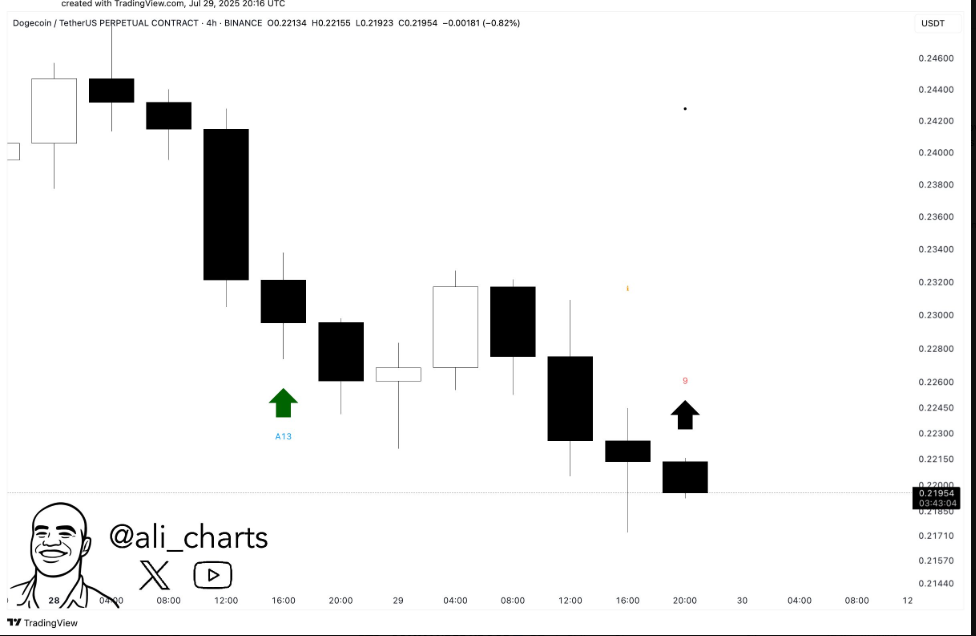 Source: Ali Martinez on X
What Do Technical Indicators Reveal About Dogecoin’s Momentum?
Technical indicators confirm that Dogecoin is losing upward momentum. The Relative Strength Index (RSI) on the 5-minute chart stands at 42.20, below the neutral 50 level, indicating increased selling pressure. A further drop below 40 could trigger more aggressive declines, although DOGE is not yet oversold.
How Does the MACD Signal Affect Dogecoin’s Price Outlook?
The Moving Average Convergence Divergence (MACD) shows a bearish crossover with both MACD and signal lines below zero, reinforcing the downtrend. This suggests that without a bullish crossover, the price is likely to continue falling. Market participants remain cautious, awaiting clear signs of reversal or further breakdown.
What Are the Key Support and Resistance Levels for Dogecoin?
Dogecoin must hold the $0.217 support level to avoid deeper corrections. A breakdown below this level could accelerate declines toward $0.212 or $0.208. Conversely, a sustained move above $0.225 with strong volume and technical confirmation is required to shift momentum bullishly.
| $0.225 | Resistance | Must break for bullish reversal |
| $0.217 | Support | Must hold to prevent further decline |
| $0.212 – $0.208 | Lower support zone | Target if $0.217 breaks |
Frequently Asked Questions
What is causing Dogecoin’s current bearish momentum?
Dogecoin’s bearish momentum is driven by technical indicators such as RSI below 50 and a MACD bearish crossover, signaling increased selling pressure and weak buying interest.
How can traders identify a potential reversal in Dogecoin’s price?
Traders should watch for a break above $0.225 with strong volume and a bullish MACD crossover, which would indicate a shift in momentum and potential price recovery.
How to Monitor Dogecoin’s Price Momentum Effectively?
Monitoring Dogecoin’s momentum involves tracking key technical indicators and price levels. Follow RSI and MACD readings closely, watch for volume changes during rallies and declines, and keep an eye on critical support and resistance zones for timely trading decisions.
Key Takeaways
- Bearish Momentum: Dogecoin is experiencing sustained selling pressure confirmed by RSI and MACD indicators.
- Critical Price Levels: Resistance at $0.225 and support at $0.217 are pivotal for future price direction.
- Market Caution: Traders should await clear technical signals before expecting a reversal or further decline.
Conclusion
Dogecoin’s price action near $0.22140 reflects ongoing bearish momentum, with technical indicators signaling weakness. Holding the $0.217 support is crucial to avoid deeper corrections, while a break above $0.225 could herald a bullish shift. COINOTAG will continue monitoring these developments to provide timely updates for traders and investors.