Dogecoin is currently showing bearish technical signals after breaking below the $0.25 support level, but liquidation heatmaps indicate a possible short-term price bounce near $0.20, contingent on Bitcoin’s performance.
-
Dogecoin failed to maintain the $0.25 support, signaling short-term bearish momentum.
-
Bitcoin’s recent price range between $116.7K and $122K influences Dogecoin’s potential recovery.
-
COINOTAG analysis highlights key liquidation zones that may trigger a price rebound in the coming days.
Dogecoin bearish signals emerge after $0.25 breach; liquidation heatmaps suggest a bounce. Follow COINOTAG for the latest crypto price insights.
Dogecoin Technical Indicators Point to Bearish Momentum
Dogecoin’s price action reveals a clear bearish trend after failing to hold the critical $0.25 support level. The 1-day chart shows the range extending from $0.142 to $0.25, with the 50-period Moving Average near $0.196 acting as a potential support zone. However, recent price movements indicate sellers dominate, as the On-Balance Volume (OBV) reached new lows and the Relative Strength Index (RSI) dipped below 50, confirming downward pressure.
How Does Bitcoin’s Performance Affect Dogecoin’s Price Movement?
Bitcoin’s stability between $116.7K and $122K has created a mixed environment for altcoins like Dogecoin. A failure by Bitcoin to reclaim the $116.7K support level could exacerbate Dogecoin’s decline. Conversely, if Bitcoin stabilizes above this threshold, it may provide the momentum needed for Dogecoin to bounce back toward $0.23, as indicated by recent liquidation heatmaps.
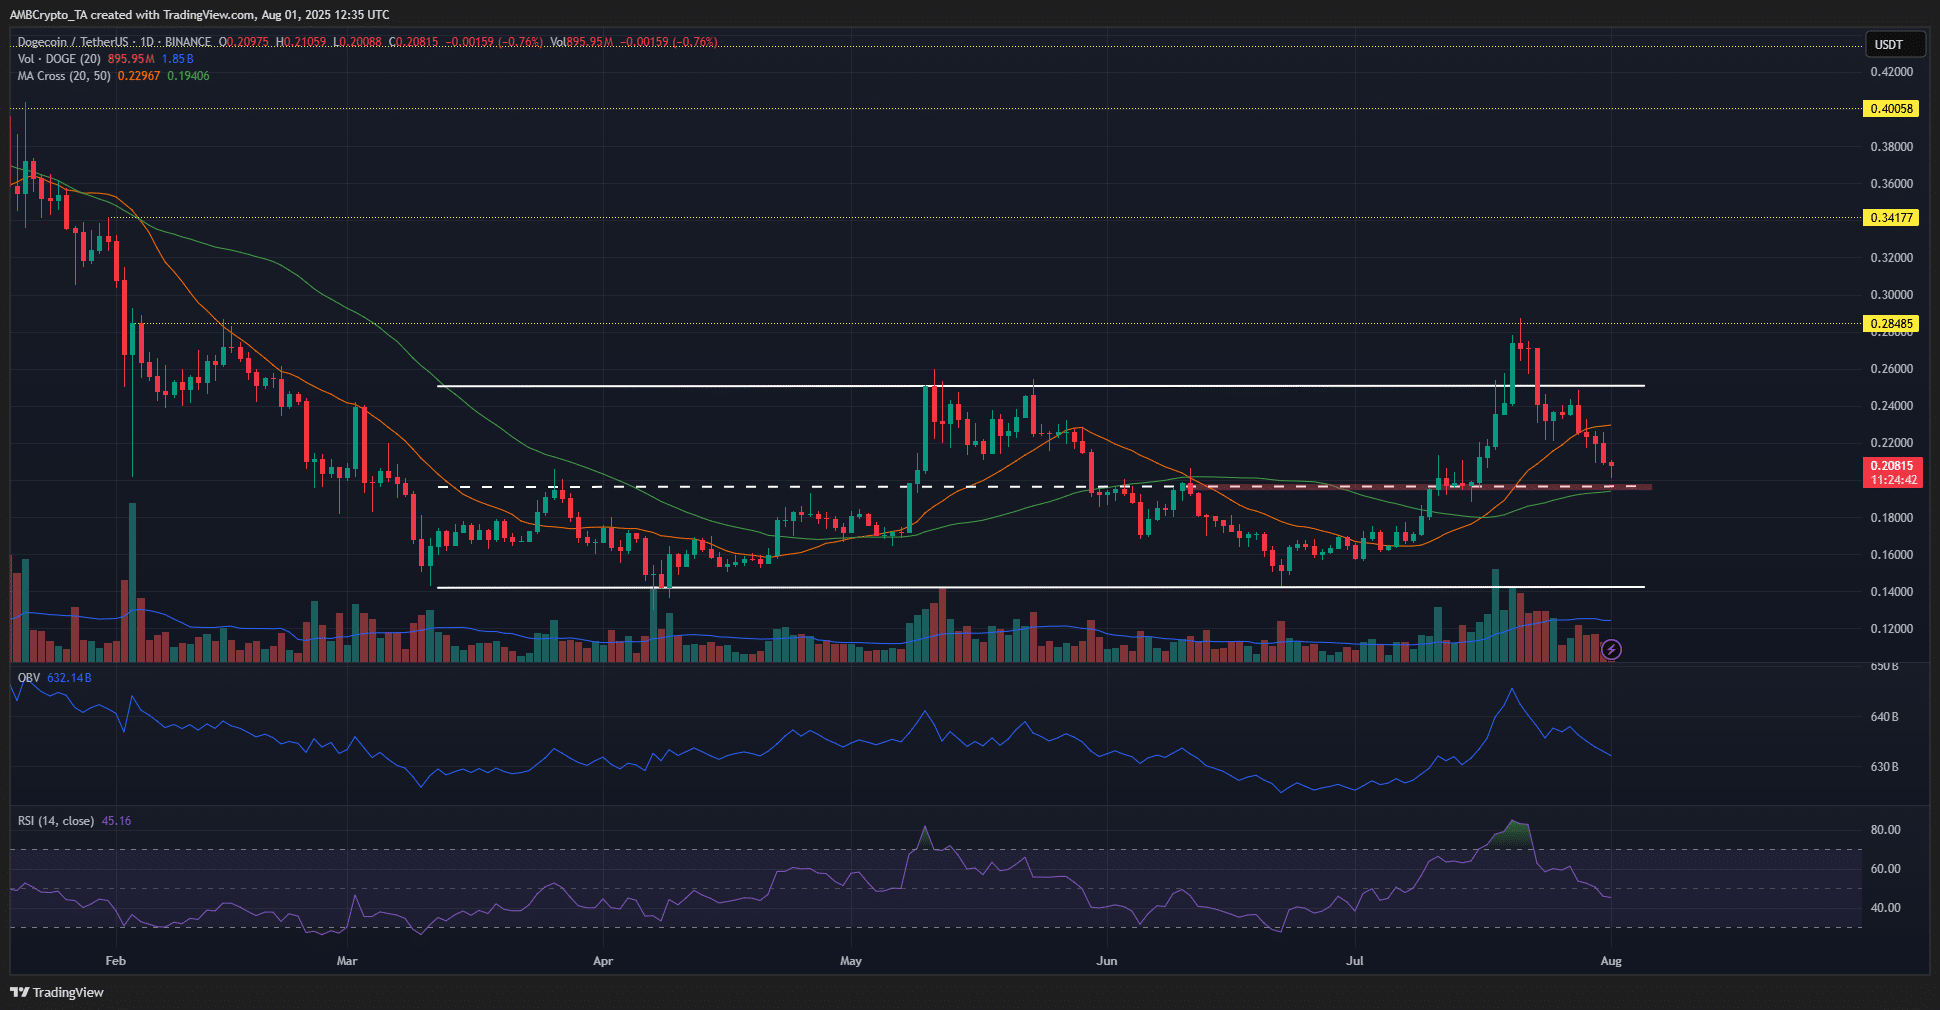
Source: DOGE/USDT on TradingView
Liquidation Heatmaps Reveal Key Price Levels for Dogecoin
Analysis of the 2-week liquidation heatmap shows significant liquidity clusters just below the $0.20 mark, suggesting strong support around this level. Overhead resistance zones at $0.227 and $0.25 remain critical barriers. These liquidity pools indicate that despite bearish pressure, price rebounds are plausible if buyers step in near these zones.
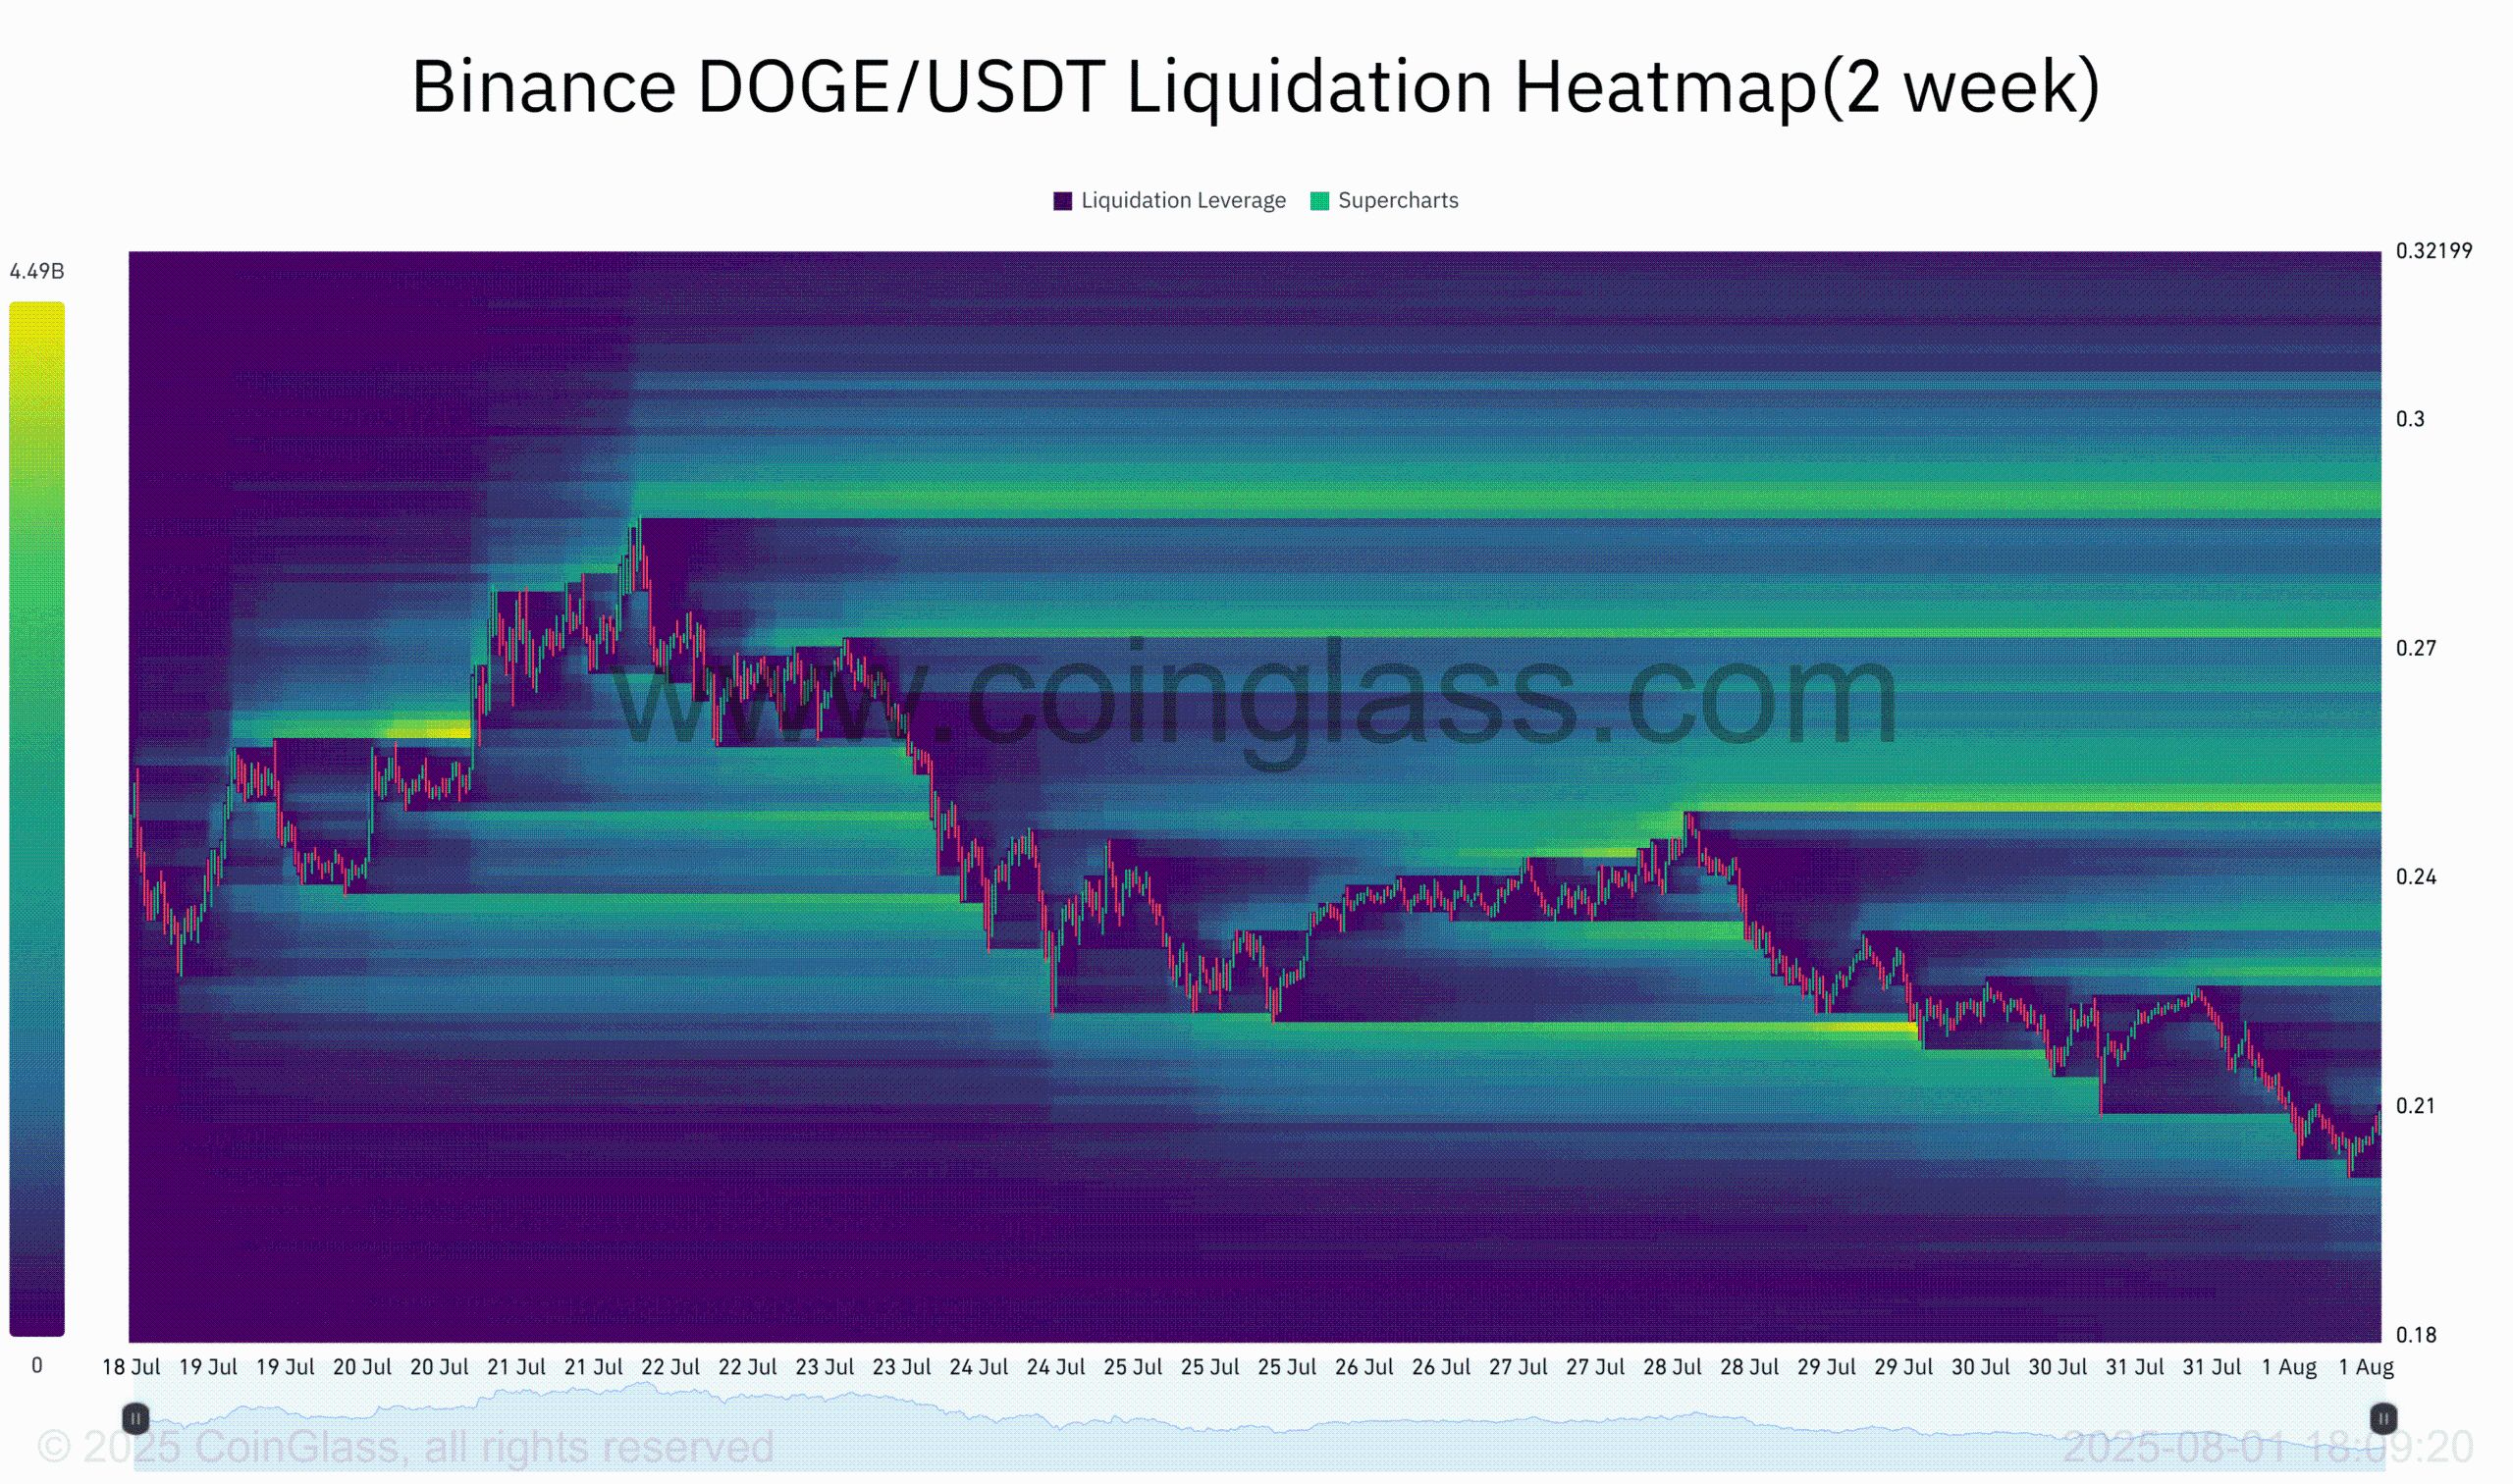
Source: Coinglass
What Does the Short-Term Liquidation Heatmap Suggest for Dogecoin?
The 3-day liquidation heatmap reinforces the possibility of a short-term price rebound to approximately $0.23. This bounce depends heavily on Bitcoin’s ability to regain and hold the $116.7K support level. Traders should watch these key levels closely to anticipate potential market shifts.
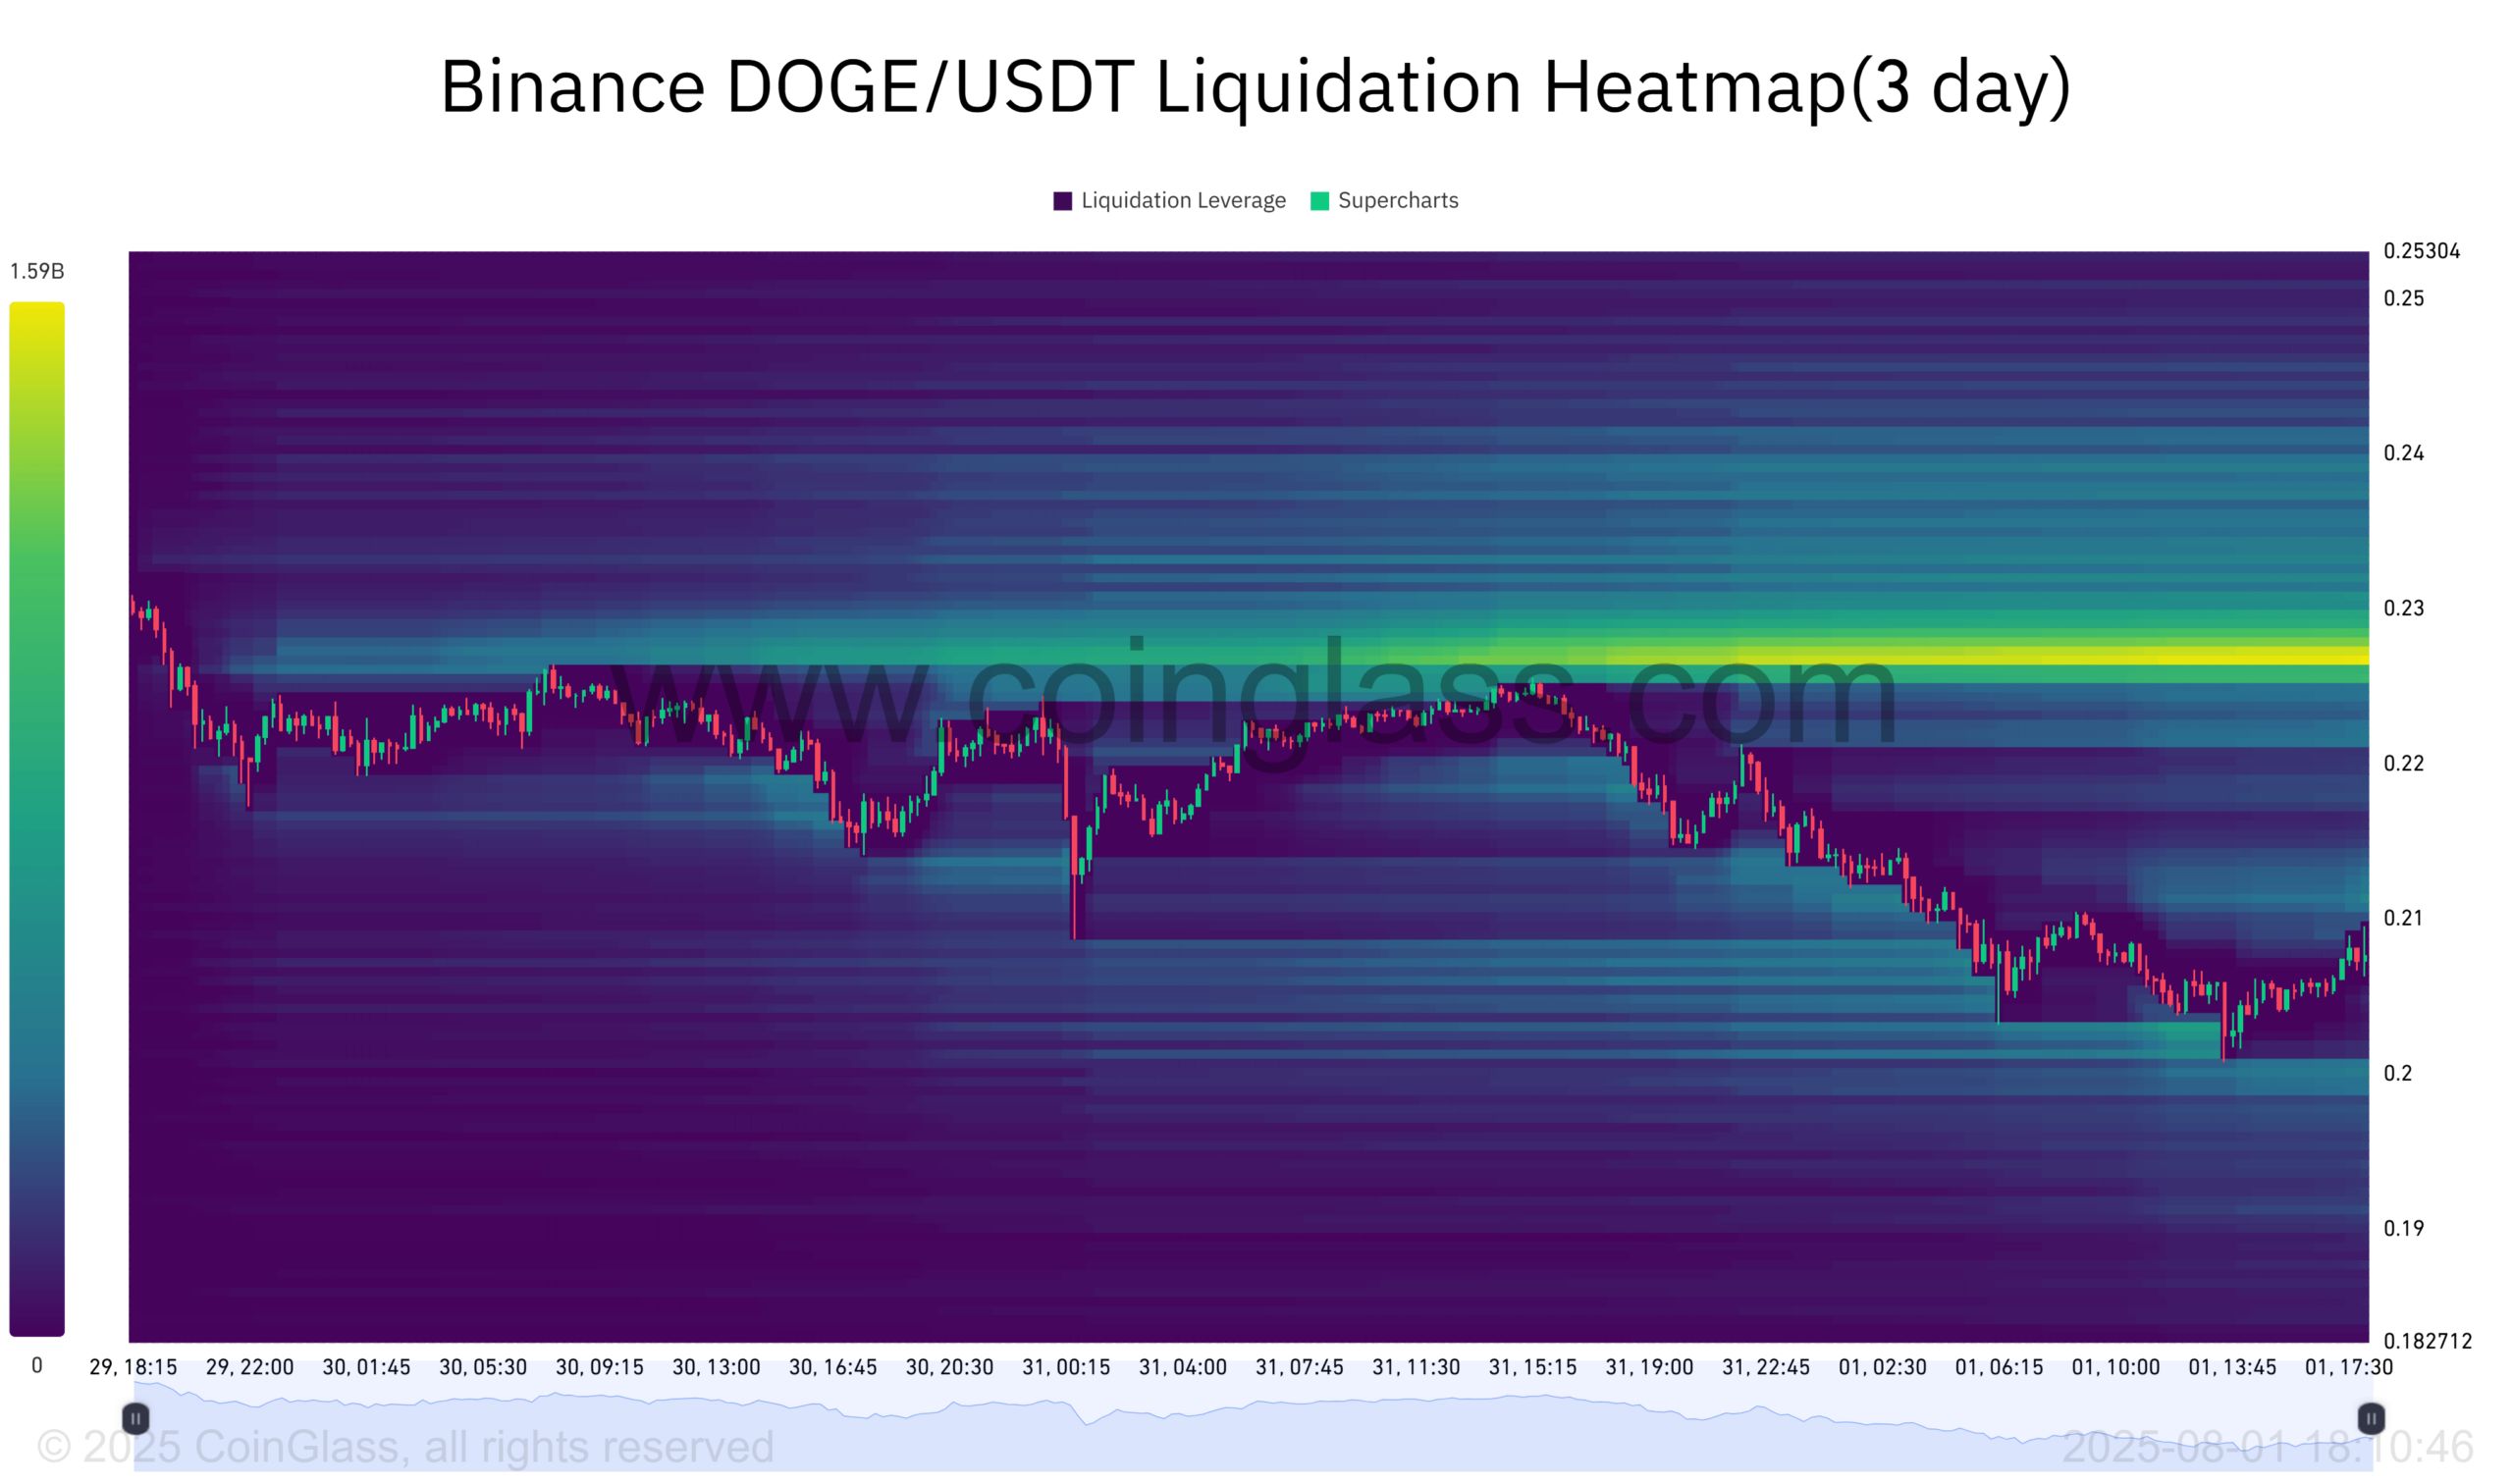
Source: Coinglass
What Are the Next Price Targets for Dogecoin?
If Dogecoin breaks below the $0.195 level decisively, the next support target is near the range low of $0.142. This would confirm a deeper bearish phase. However, if the $0.196 mid-range support holds, swing traders may find opportunities to enter positions while waiting for clearer directional cues.
| $0.25 | Previous support turned resistance | Bearish rejection signals downward pressure |
| $0.196 | Mid-range support & 50 MA | Key level for potential price bounce |
| $0.142 | Range low support | Next major support if $0.195 breaks |
Frequently Asked Questions
What is causing Dogecoin’s recent price decline?
Dogecoin’s price decline is primarily due to bearish technical indicators, including a break below the $0.25 support level and weakening momentum shown by OBV and RSI metrics.
How can Bitcoin’s price affect Dogecoin’s market movement?
Bitcoin’s price stability is crucial; if Bitcoin holds above $116.7K, it could support a Dogecoin rebound. Conversely, Bitcoin dropping below this level may increase selling pressure on Dogecoin.
Key Takeaways
- Bearish Technical Signals: Dogecoin failed to defend $0.25 support, with OBV and RSI indicating selling pressure.
- Bitcoin Influence: BTC’s price range impacts Dogecoin’s short-term price movements and potential recovery.
- Liquidation Heatmaps: Show key liquidity zones near $0.20 and resistance at $0.227-$0.25, suggesting possible price bounce.
Conclusion
Dogecoin is currently under bearish pressure after losing the $0.25 support, but liquidation heatmaps and Bitcoin’s price action suggest a possible short-term bounce near $0.20. Investors should monitor key support levels and Bitcoin’s performance closely. COINOTAG will continue providing timely updates on Dogecoin and broader crypto market trends.