

Date: Sun, Aug 03, 2025 | 09:38 AM GMT
The broader crypto market continues to struggle under selling pressure, with Ethereum (ETH) leading the drop — falling from its recent high of $3,940 to around $3,460. That’s an 8% weekly decline, and the impact has been felt across the major altcoins . Hyperliquid (HYPE) hasn’t escaped the storm either, shedding 10% over the past week and giving up its monthly gains.
But even amid the decline, there may be a silver lining. A developing harmonic pattern on HYPE’s daily chart suggests that a potential bounce back could be in motion.
 Source: Coinmarketcap
Harmonic Pattern Hints at Potential Bounce
On the daily timeframe, HYPE is shaping a Bearish ABCD harmonic pattern — a structure that, despite its name, often features a strong bullish move in the CD leg before reaching a potential reversal zone.
The pattern initiated at Point A (~$30.93), rallied to Point B, retraced to Point C (~$35.47) — where it bounced from the 100-day moving average area — and has since climbed to the current level around $38.50. This bounce marks the early phase of the CD leg, which could propel HYPE higher toward Point D, completing the harmonic formation.
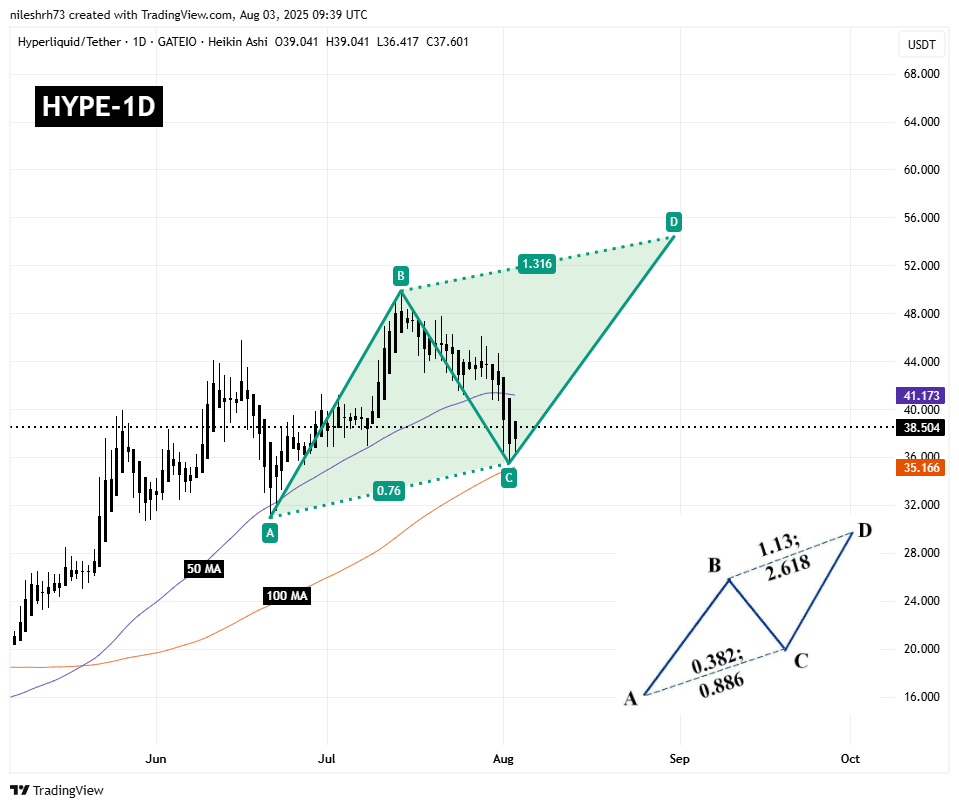 Hyperliquid (HYPE) Daily Chart/Coinsprobe (Source: Tradingview)
A move above the 50-day moving average ($41.17) would strengthen the bullish outlook and confirm pattern progression.
What’s Next for HYPE?
If HYPE maintains its upward momentum and decisively clears the 50-day MA, the next major target lies near the Potential Reversal Zone (PRZ). This is defined by the 1.31 Fibonacci extension of the BC leg — landing near $54.39, which suggests a 41% potential upside from current prices.
However, the pattern is not bulletproof. If bulls fail to hold support at the 100-day MA ($35.16) or the C-leg low around $35.47, the harmonic setup would be invalidated — potentially opening the door for a drop back toward the $31.00 region.


