

XRP is currently trading near a crucial resistance level of $3.27, with analysts suggesting that a breakout could lead to a target of $3.60.
-
XRP trades near $3.27 resistance, with a breakout potentially targeting $3.37, $3.51, and $3.55–$3.60.
-
Price is above 50-day and 200-day MAs, indicating bullish momentum despite lower address activity in early August.
-
Fibonacci levels show $3.1904 as immediate support, with deeper zones at $3.0159 and $2.9129 if selling pressure increases.
XRP is nearing a critical resistance level at $3.27, with analysts forecasting a potential breakout towards $3.60. This article explores the price dynamics and market activity surrounding XRP.
What is the Current Price Outlook for XRP?
XRP is trading near a key price level that could determine its next move in the short term. According to analyst Ali, a break above $3.27 may lead toward $3.60. The digital asset has been consolidating after a strong rally, staying above several key technical supports.
How Have Recent Market Trends Impacted XRP?
The recent correction has kept XRP within a descending parallel channel, marked by lower highs and lows. Fibonacci retracement levels from the $2.91 low to the $3.37 high show $3.27 as immediate resistance.
| $3.27 | $3.60 | $3.19 |
Technical Levels and Price Outlook
This level also aligns with the upper channel boundary. Support is at $3.19, corresponding to the 0.618 Fibonacci level. Below that, $3.13 and $3.08 are additional supports, with deeper zones at $3.01 and $2.91.
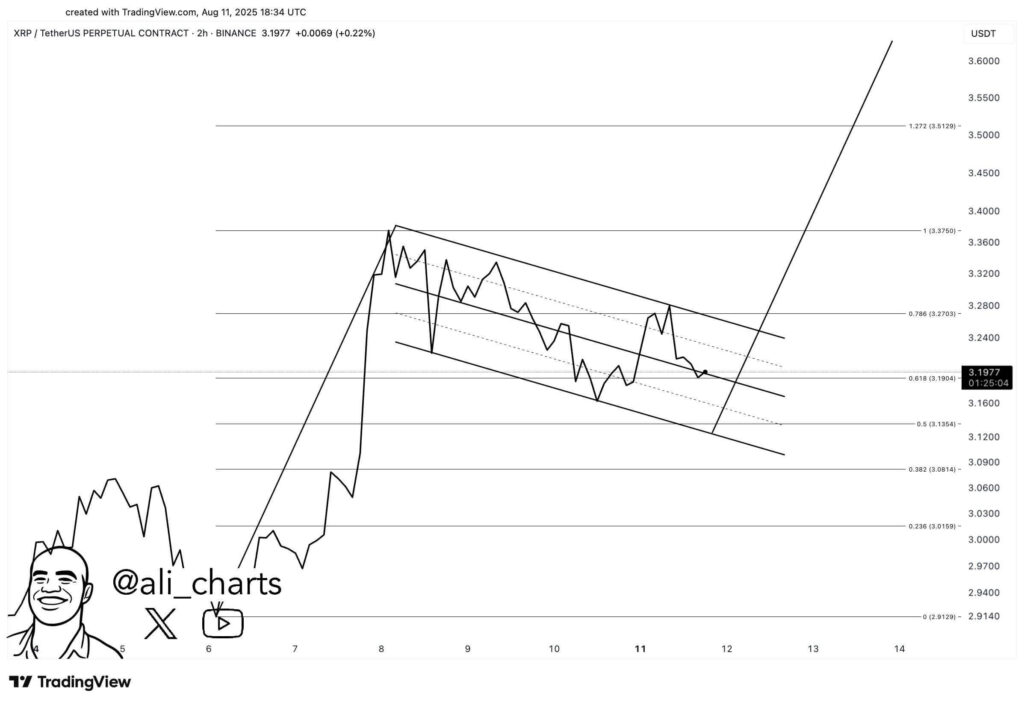 XRP/USDT Perpetual Contract 2-hour price chart, Source: Ali on X
The breakout target, if $3.27 is surpassed, includes $3.3750 and $3.5129, with a possible extension toward $3.55–$3.60. However, a drop under $3.16 could lead to $3.13 and $3.08, with $3.02–$2.92 as stronger downside areas.
Market Activity and Historical Price Trends
From mid-February to late March, XRP declined from above $3.20 to the $2.10–$2.20 range. This period saw active addresses spike above 600K in early March, suggesting strong on-chain activity during the drop. The 50-day moving average stayed below the 200-day moving average then, confirming a bearish setup.
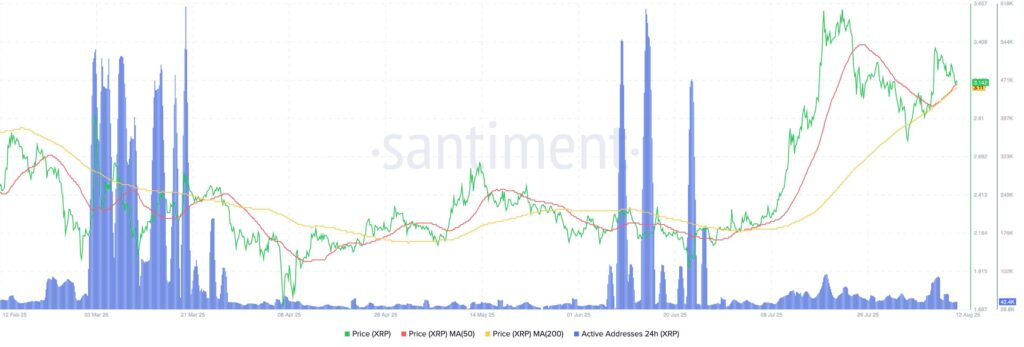 XRP price dynamics chart, Source: Santiment
Between April and early July, the price consolidated between $2.10 and $2.70. Address activity was subdued, with brief surges above 500K in mid-June, showing intermittent activity without a sustained breakout.
Current Setup and Momentum Indicators
A breakout in mid-July pushed XRP from $2.40 to $3.65, with the golden cross indicating stronger upward momentum. Active addresses reached around 250K during the rally but have since declined. The price is now holding near $3.14, close to the 50-day moving average at $3.11 and well above the 200-day average at $2.65.
The sustained position above both moving averages suggests strength, though lower address activity could limit short-term volatility. Maintaining price above $3.10 could lead to a retest of higher resistance levels, with $3.27 as the key breakout point.
Key Takeaways
- Resistance Level: XRP is facing a critical resistance at $3.27.
- Support Levels: Immediate support is at $3.19, with deeper supports at $3.01 and $2.91.
- Market Activity: Active addresses have declined, indicating a potential impact on price volatility.
Conclusion
XRP is at a pivotal point, trading near $3.27. A breakout could lead to significant upward movement towards $3.60, while maintaining support levels will be crucial for its price stability. Investors should monitor these levels closely for potential trading opportunities.


