

- Dogecoin dominance has broken above a multi-year descending resistance line, signaling a potential sustained uptrend.
- RSI at 64 and a bullish MACD crossover confirm strong participation without overbought pressure.
- Equal buy/sell volume near $36.98B underscores stability as dominance rises toward past resistance levels.
The dominance of dogecoin has shown significant growth in the last few months, with the value of $2.14, showing an increasing market share in the goods market. The chart shows an apparent break-out of a long-term descending wedge side chart, indicating the transition in the market dynamics. This trend is supplemented by the volume activity, which indicates a high degree of interest among traders as Doge traded at $0.2464 with a 8.9% price increase .
It is notable that the trend of the price is stable in an upward direction, establishing a regression of ascending lows since the beginning of 2025. The monitors of market cap statistics note that the current dominance of Dogecoin is higher than past temporary spikes and indicates stable trading pairs and capitalization interest.
Dogecoin Breaks Long-Term Resistance, Establishing Continued Dominance
The chart reveals Dogecoin breaking above a descending resistance line that has constrained dominance since 2021. This breakout is accompanied by a minor pullback, which now forms a potential base for further increases. Observers note that the wedge pattern provides a structured framework for assessing dominance swings, with historical data indicating previous surges following similar formations.
Moreover, the trend suggests that dominance is entering a phase of sustained upward movement, connecting recent highs with broader market participation. Such technical consistency shows the increasing market attention, and Dogecoin has not lost significance in the key altcoin shifts.
Technical Indicators Signal Strong Momentum
Technical signals can confirm the direction with the Relative Strength Index (RSI) coming close to 64, indicating viable momentum but not overbought. Furthermore, the MACD line has recently broken above the signal line, and the difference between the lines is considerably high, signifying the change in market dynamics.
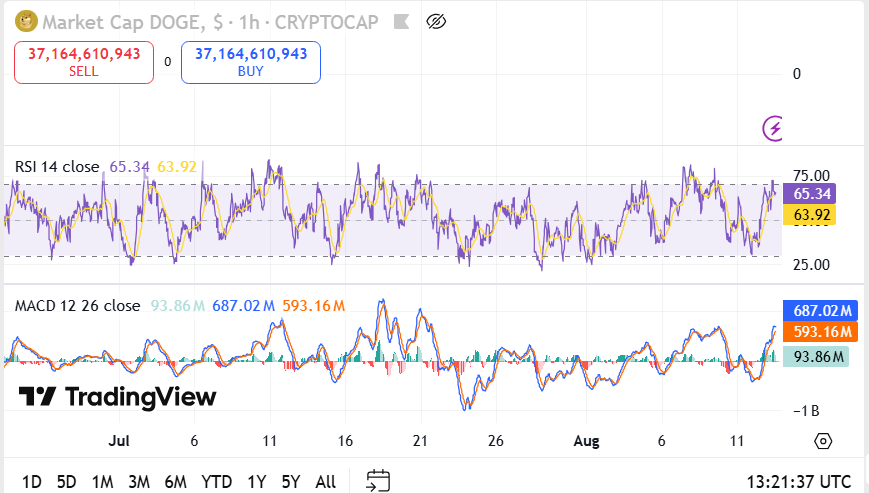 Source: TradingView
Volume data also corroborates these indicators, confirming heavy trade activity. Together, these steps provide empirical evidence of increasing dominance, closing the gap between technical analysis and observable market action. Investors can monitor these metrics to follow Dogecoin’s changing place in the crypto capitalization structure, particularly relative to other high-liquidity coins.
Short-Term Trajectory and Observed Movements
Current patterns indicate that Dogecoin dominance could advance toward higher levels if the trend continues. Notably, breakout targets align with past resistance zones, creating measurable points for tracking shifts. Volume participation remains balanced, with buy and sell levels nearly identical at approximately $36.98 billion each.
This balance supports the notion that Dogecoin dominance is stabilizing while preparing for potential upward movement. The combination of technical formation, indicator signals, and balanced volume provides a clear and fact-based overview of Dogecoin’s current market positioning.


