
Bitcoin charts are similar to the 2021 top: Will history rhyme?

Bitcoin’s price chart is starting to mimic the pattern it displayed when it reached the previous cycle’s all-time high of $69,000 in November 2021, according to a crypto trader.
Other traders argued that charts don’t tell the full story now, amid mounting demand for Bitcoin from crypto treasury companies.
Bitcoin charts look similar to 2021, trader says
Technical analysts often compare Bitcoin’s price chart to similar patterns in past cycles to figure out when the price might peak, when to sell and when money may start rotating into other assets.
“Has anyone else noticed that the topping price action in 2021 looks exactly the same as current price action?” crypto trader Nebraskangooner said in an X post on Thursday, pointing to a chart showing what appeared to be a double top pattern often viewed by traders as bearish.
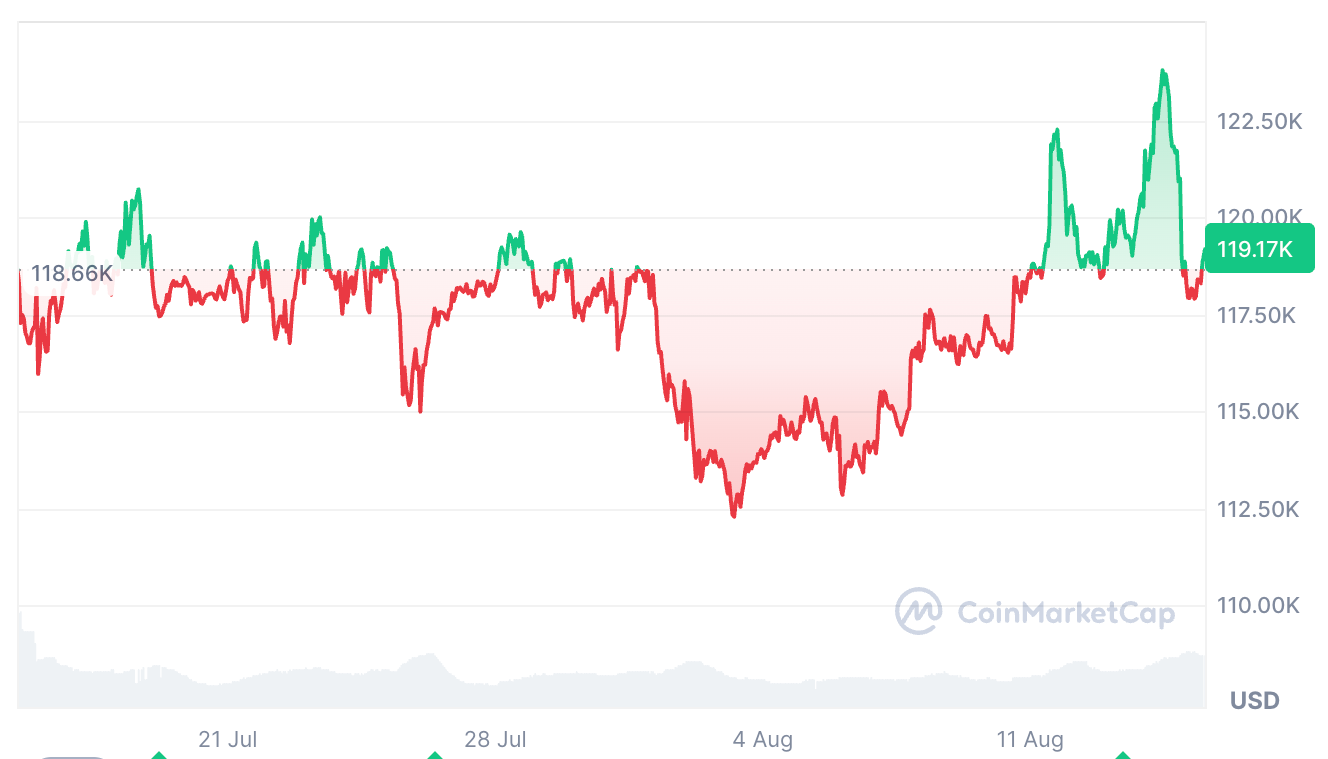 Bitcoin has fallen 4.3% over the past 24 hours, after reaching a new all-time high of $124,100 on Thursday. Source: CoinMarketCap
Crypto analyst Benjamin Cowen agreed, suggesting that the Bitcoin chart tracks the same pattern each post-halving year.
“Up in July-Aug. Down in Sep. Up into the market cycle top in Q4. Bear Market,” he said.
Traders using charts to predict prices are “fooling themselves”
Still, crypto trader Kale Abe said Nebraskangooner’s observation was “another instance where charts and fractals don’t matter.”
“The only thing that matters is the treasury companies and if they are out of ammo or not,” Kale Abe said. BitcoinTreasuries.Net data shows that $150.98 billion worth of Bitcoin has been scooped up by publicly traded Bitcoin treasury companies.
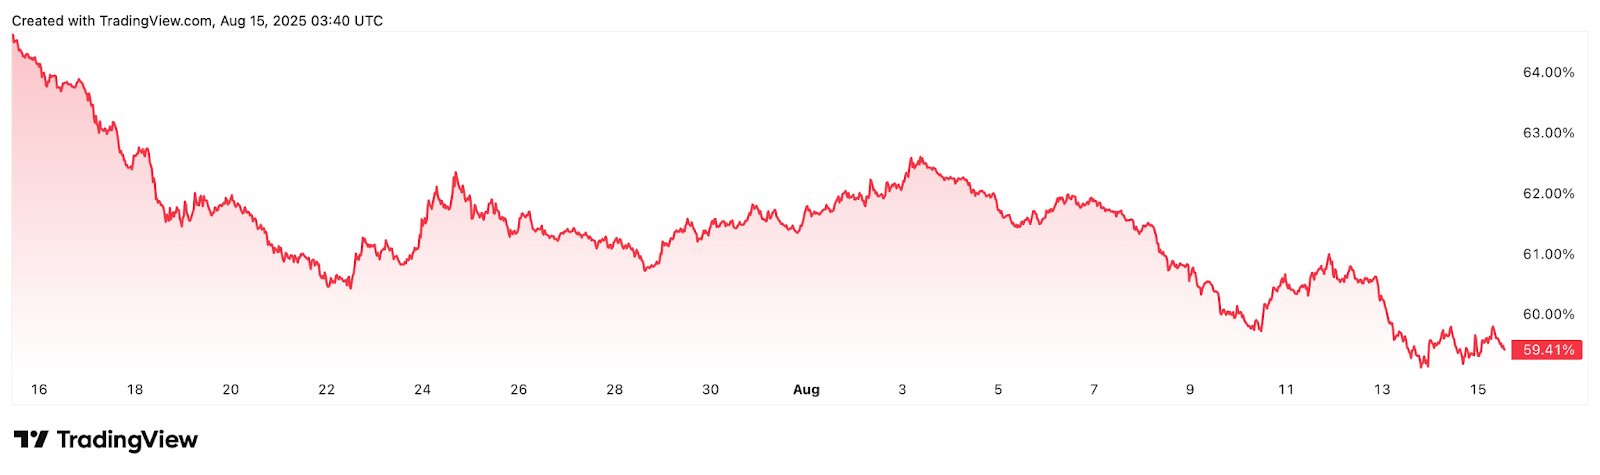 Bitcoin dominance, which measures Bitcoin’s overall market share, fell 6.55% over the past 30 days. Source: TradingView
Abe also doubted that Bitcoin would go “into a bear market” as Ether is nearing its all-time highs. “Impossible,” he said. Ether is up 19% over the past seven days, trading at $4,612, about 5.75% below its 2021 all-time highs of $4,878.
It comes just a few weeks after veteran trader Peter Brandt told Cointelegraph Magazine , “Anyone that looks at the charts and tries to tell you where anything is going is actually just kind of fooling themselves.”
Brandt said the only real use of a price chart is seeing where the price has been and where it is now.
Disclaimer: The content of this article solely reflects the author's opinion and does not represent the platform in any capacity. This article is not intended to serve as a reference for making investment decisions.
You may also like
Musk on chip production: China's large-scale manufacturing capacity often exceeds the sum of all other regions worldwide
After ChangXin Memory Technologies announced a key breakthrough in DDR5 server memory, the Philadelphia Semiconductor Index in the US stock market fell 2.7% overnight, with shares such as Micron and SK Hynix ADR dropping collectively. Musk commented on this trend, saying that when China figures out the manufacturing method of a product, its ability to scale production often exceeds that of the rest of the world combined, and stated that "China seems to be rapidly conquering" general standard specifications such as LP5 and LP6.

IREN reports $702.6 million net loss despite $4 billion in AI cloud contracts
The current AI frenzy: featuring both "Tech and Internet" and "Real Estate" bubble characteristics, reminiscent of the 2008 global capital cycle
This wave of the AI boom exhibits dual characteristics: On a micro level, the heavy-asset nature of AI data centers is driving the industry toward "real estate-like" debt financing models, such as corporate bonds, private credit, and computing power ABS. On a macro level, nearly $2 trillion in overseas excess savings is flowing into core AI assets in the U.S. stock market through private institutions, reconstructing a transnational capital cycle reminiscent of the period before the 2008 subprime mortgage crisis. With nearly $3 trillion in off-balance sheet debt and rising interest rates, the industry is facing an impending major liquidity test.

AI Trading Faces a "Vulnerable Moment"! Japan and South Korea Stock Markets Experience "Black Tuesday" as SK Hynix, Samsung, and SoftBank Plunge Together
On Tuesday, Asian tech stocks faced a new round of systemic sell-off as the overnight weakness in the US semiconductor sector spread to the Asia-Pacific market. Concerns intensified over increasingly fierce competition due to the technological breakthrough by Chinese memory chip manufacturer ChangXin Memory Technologies, as well as worries about the returns on AI capital expenditure and the overall financing environment.
Crypto prices
More


