
Pi Coin Now Trades Like Any Top Meme Coin — Will Price Gains Follow?

Pi Coin’s market behavior has shifted, aligning with leading meme coins like Dogecoin, Shiba Inu, Bonk, and Floki. This correlation could open the door for further gains if meme coin sentiment improves, but a pending death cross on the 4-hour chart poses a clear downside risk.
The Pi Coin price is up 5.5% over the past week, outperforming XRP, BCH, Ton, and even Uniswap. However, the broader bearish shift has forced investors to ask questions.
A new line of thought has surfaced, putting its price behavior in the same lane as coins from a popular crypto sector; a shift that could redefine its short-term outlook.
Pi Coin Correlation Now Mirrors Meme Coin Majors
The latest monthly correlation data shows PI’s market behavior has shifted significantly. It now holds a 0.76 correlation with Dogecoin, 0.84 with Shiba Inu, 0.89 with Bonk, and 0.86 with Floki. These numbers place PI firmly inside the meme coin volatility bracket, meaning the sector’s rallies and corrections are more likely to spill over into the Pi Coin price action.
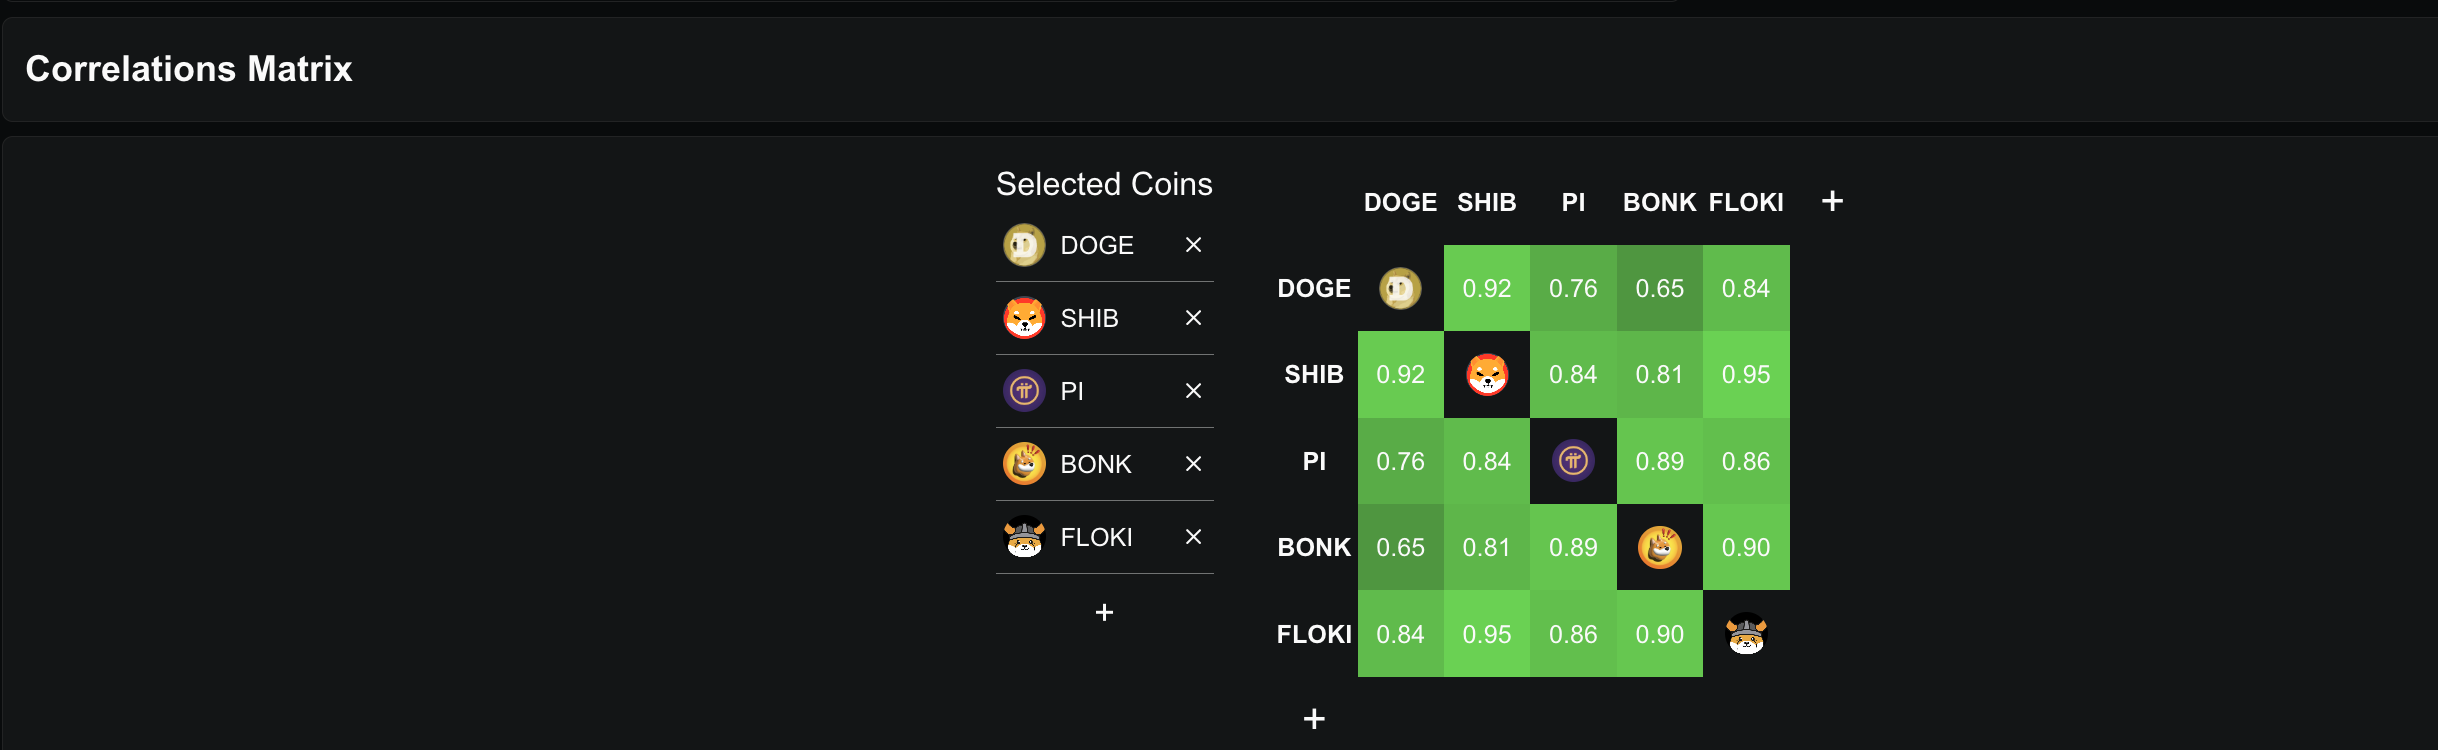 Pi Coin correlation with top meme coins:
DeFillama
Pi Coin correlation with top meme coins:
DeFillama
If meme coins start another upside run, PI could ride that momentum. Conversely, if the sector cools off, PI’s recent alignment means it could quickly follow them lower, making meme coin sentiment the most important short-term driver for Pi Coin’s direction.
A Pearson Correlation Matrix is a table that shows how strongly different variables move in relation to each other, using Pearson’s correlation coefficient values between -1 and +1. A value close to +1 means two variables move in the same direction most of the time, a value close to -1 means they move in opposite directions, and a value near zero means there is little to no linear relationship. In crypto analysis, it’s often used to measure how closely a coin’s price changes track with or diverges from other coins over a set period.
For token TA and market updates: Want more token insights like this? Sign up for Editor Harsh Notariya’s Daily Crypto Newsletter here.
Technical Risk Builds on the 4-Hour Chart
Pi Coin’s rising correlation with leading meme coins means it might now be more exposed to sector-wide moves. Over the past few days, the meme coin market has been under pressure, and if this weakness persists, Pi Coin could be dragged lower in tandem.
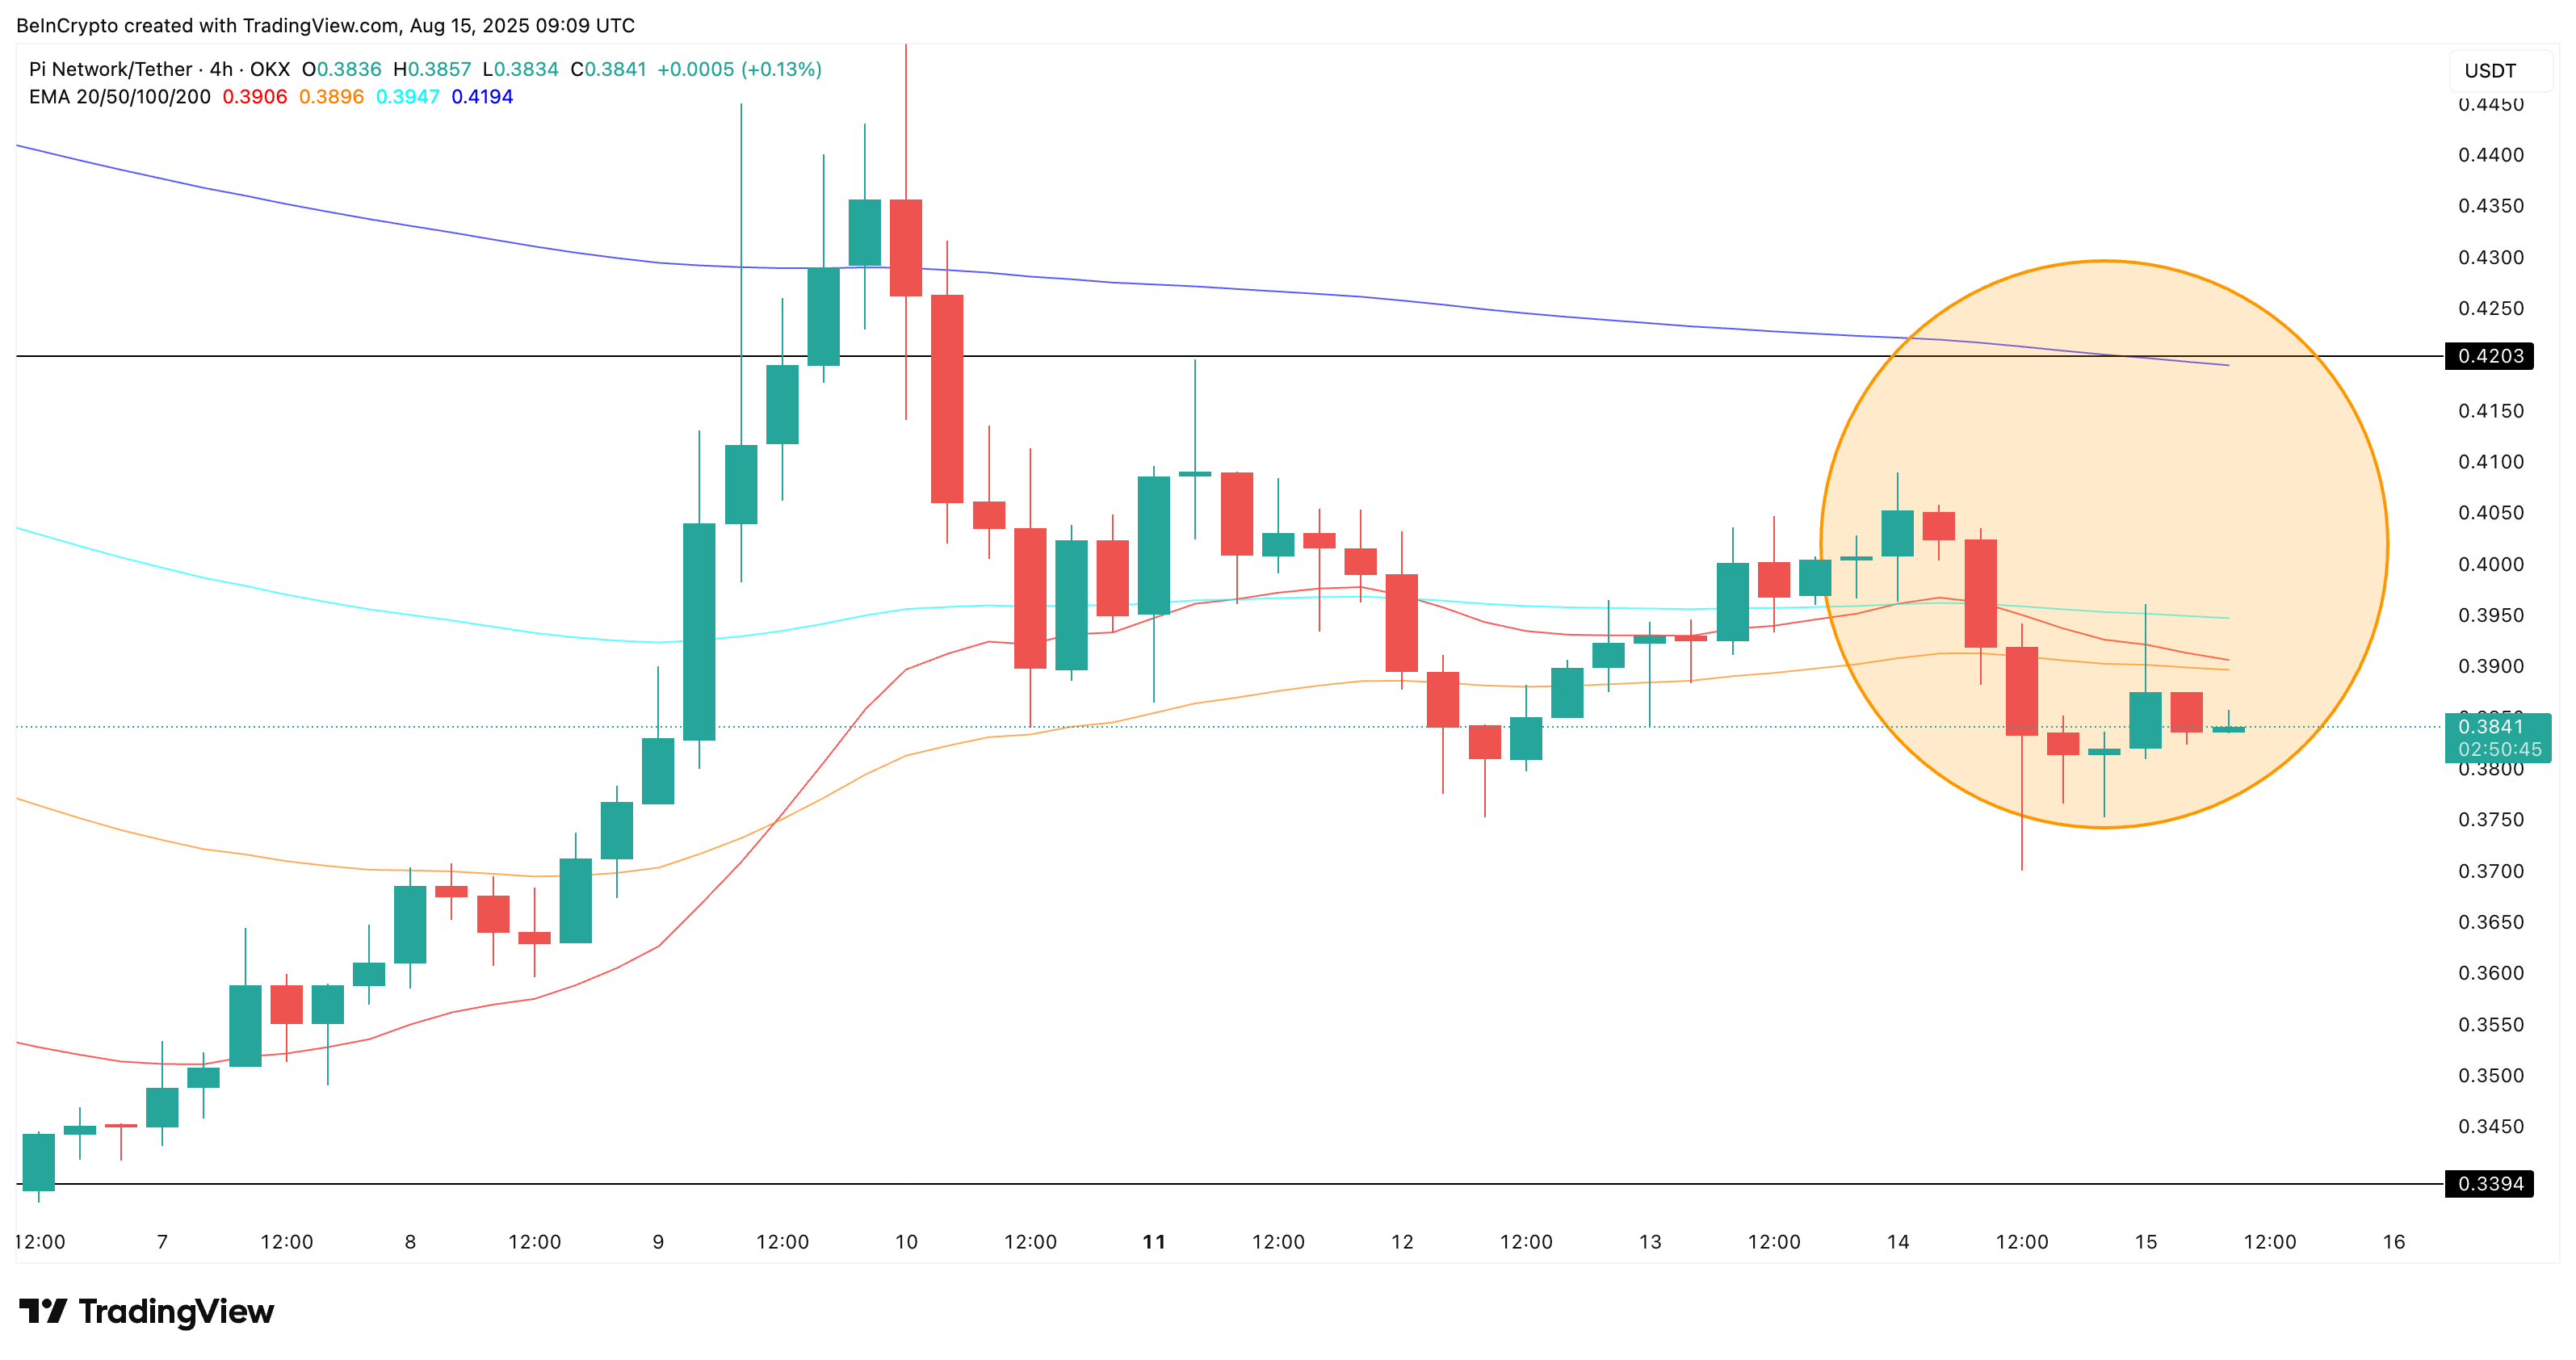 Looming Pi Coin death crossover:
TradingView
Looming Pi Coin death crossover:
TradingView
On the 4-hour chart, the 20-period EMA or Exponential Moving Average (orange line) is edging closer to crossing below the 50-period EMA (red line); a pattern known as a death crossover. If this crossover confirms while meme coin sentiment remains negative, it could accelerate selling pressure and deepen the current correction.
An Exponential Moving Average (EMA) is a type of moving average that gives more weight to recent price data, making it more responsive to short-term price movements compared to a Simple Moving Average (SMA).
Pi Coin Price Action Holds a Bullish Divergence Setup
The Pi Coin- Meme Coin link means any recovery in that space could spill over into PI’s price action.
On the daily chart, the token shows a clear bullish RSI divergence; price has made a lower high, but RSI has printed a higher high. RSI is holding near 43.71, and a push above 47 would confirm a fresh higher high, strengthening the bullish case.
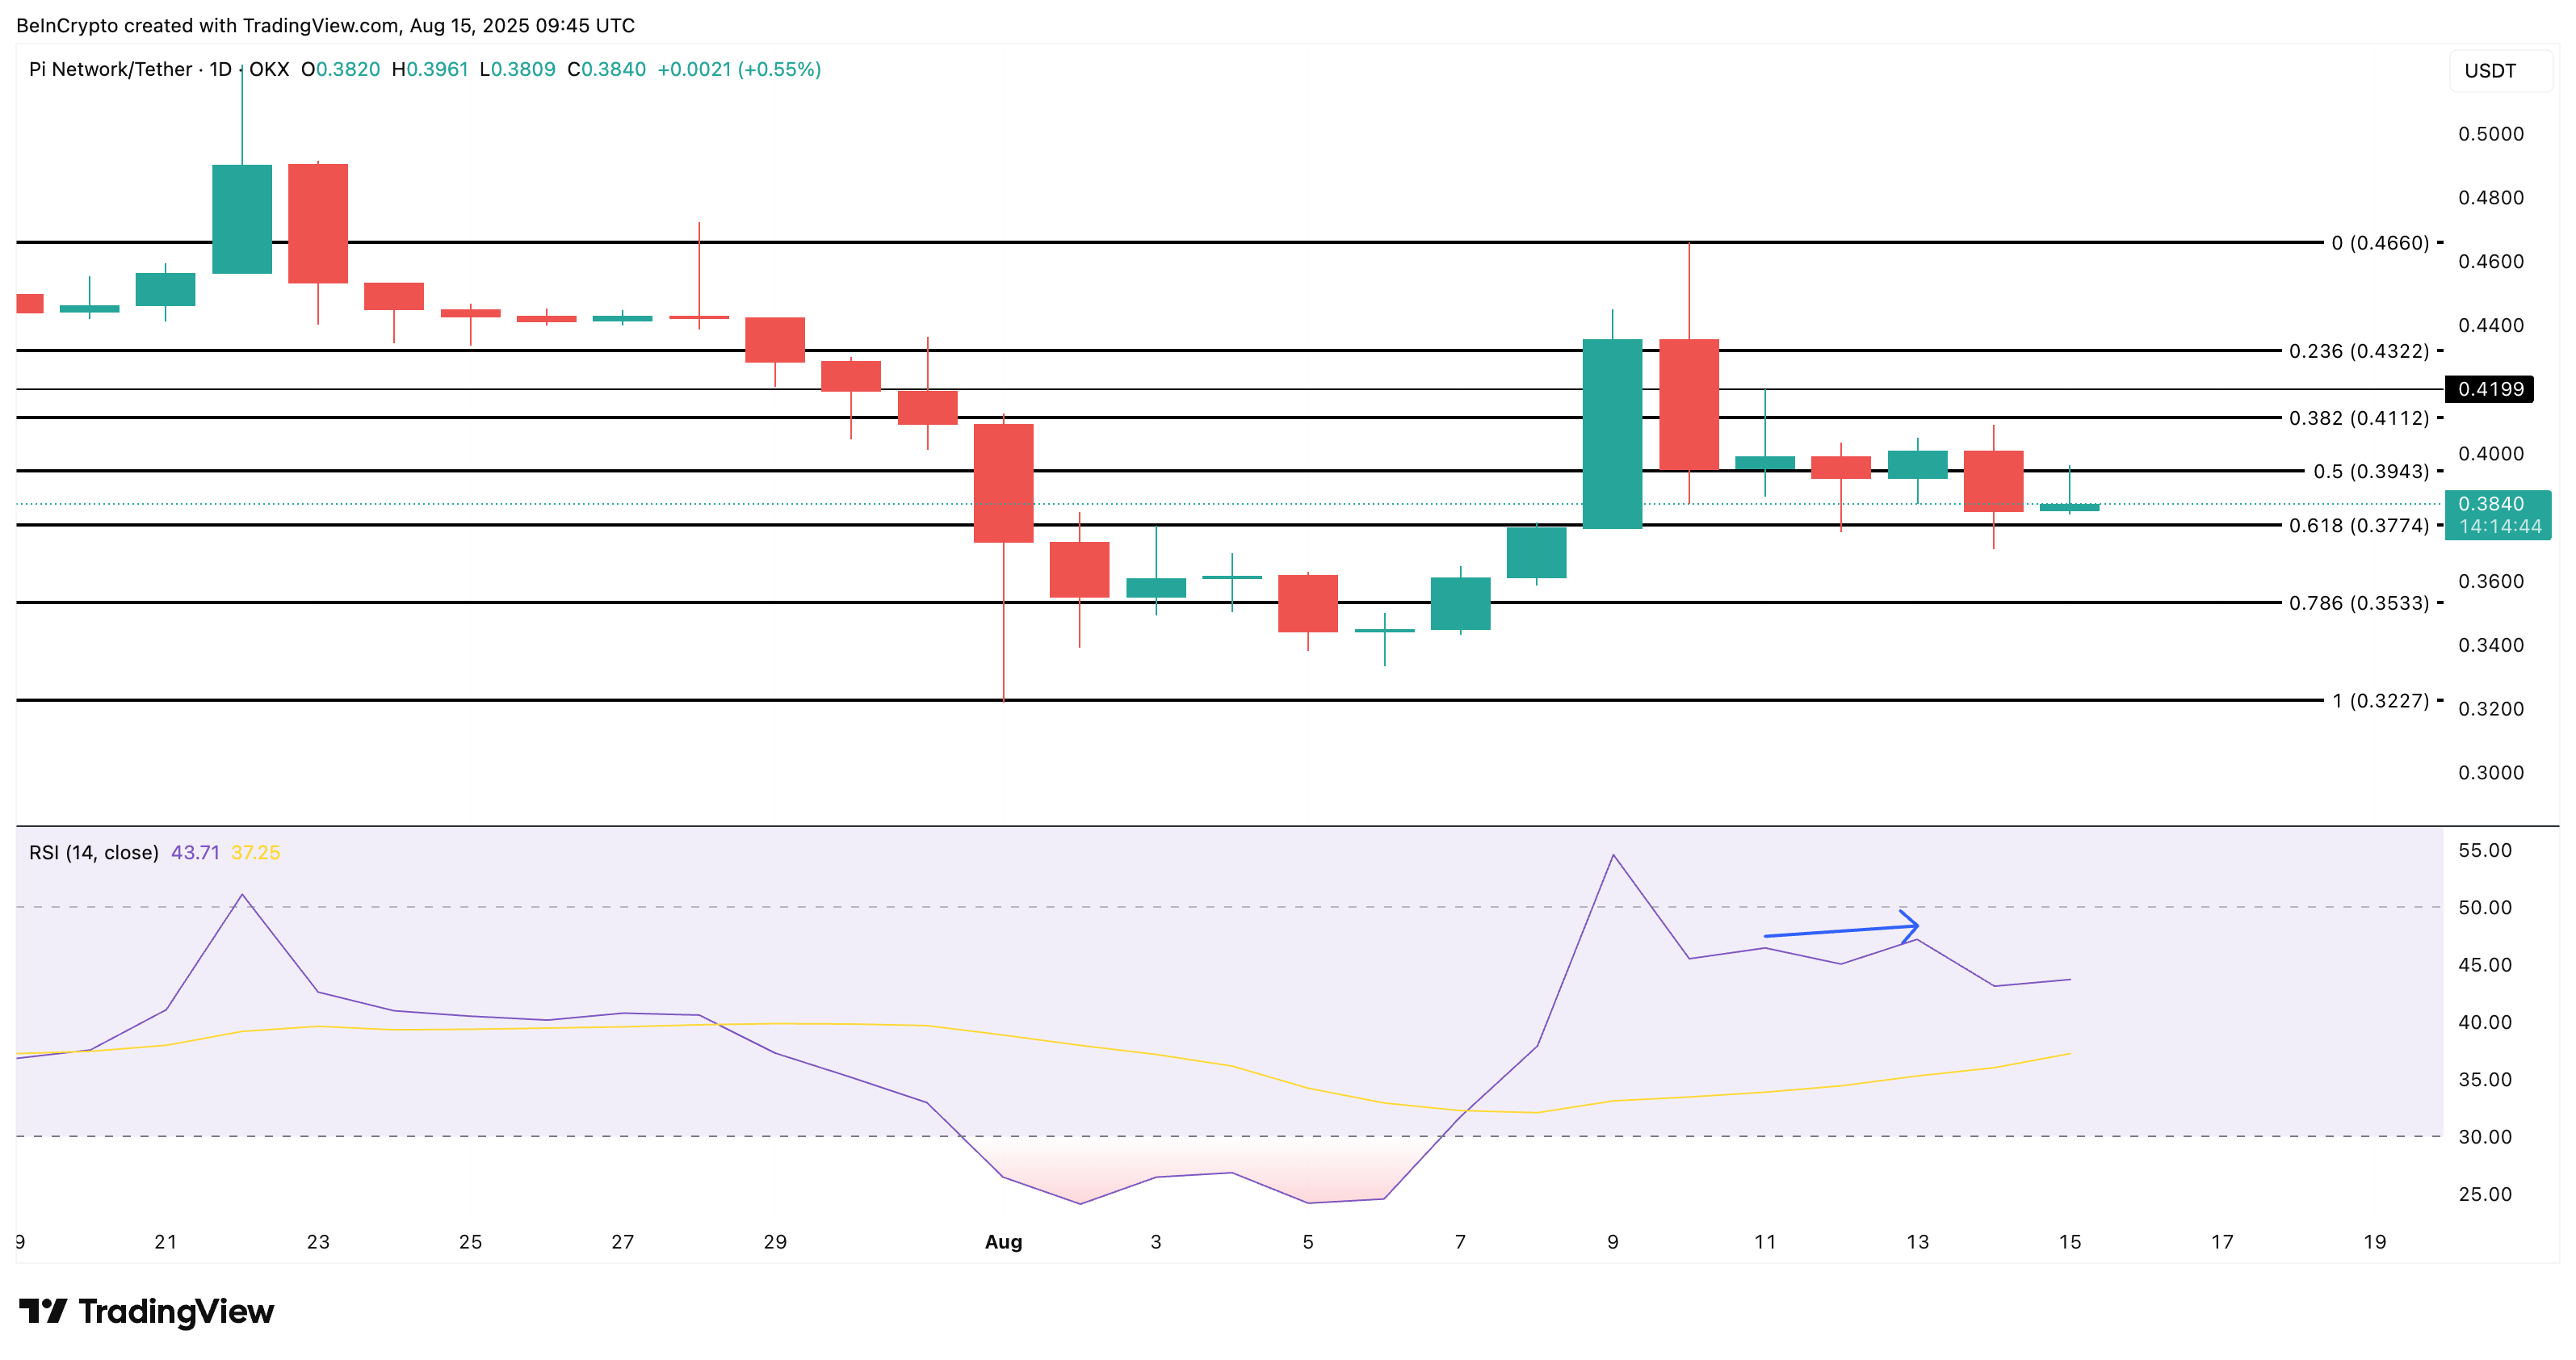 Pi Coin price analysis:
TradingView
Pi Coin price analysis:
TradingView
If meme coins stage a rebound, that momentum could be the missing trigger for the Pi Coin. That could help PI reclaim $0.39 and retest $0.41–$0.43. Until then, the setup remains unconfirmed, and the 4-hour death cross risk still shadows the chart.
A breakdown under $0.37 would not just invalidate the divergence but also make Pi coin more vulnerable. More so if the correlated sector continues to bleed. The price chart still has a semblance of bullishness. But the sector trend will decide whether that edge turns into a breakout or fades with the rest of the market.
Disclaimer: The content of this article solely reflects the author's opinion and does not represent the platform in any capacity. This article is not intended to serve as a reference for making investment decisions.
You may also like
Musk on chip production: China's large-scale manufacturing capacity often exceeds the sum of all other regions worldwide
After ChangXin Memory Technologies announced a key breakthrough in DDR5 server memory, the Philadelphia Semiconductor Index in the US stock market fell 2.7% overnight, with shares such as Micron and SK Hynix ADR dropping collectively. Musk commented on this trend, saying that when China figures out the manufacturing method of a product, its ability to scale production often exceeds that of the rest of the world combined, and stated that "China seems to be rapidly conquering" general standard specifications such as LP5 and LP6.
IREN reports $702.6 million net loss despite $4 billion in AI cloud contracts
The current AI frenzy: featuring both "Tech and Internet" and "Real Estate" bubble characteristics, reminiscent of the 2008 global capital cycle
This wave of the AI boom exhibits dual characteristics: On a micro level, the heavy-asset nature of AI data centers is driving the industry toward "real estate-like" debt financing models, such as corporate bonds, private credit, and computing power ABS. On a macro level, nearly $2 trillion in overseas excess savings is flowing into core AI assets in the U.S. stock market through private institutions, reconstructing a transnational capital cycle reminiscent of the period before the 2008 subprime mortgage crisis. With nearly $3 trillion in off-balance sheet debt and rising interest rates, the industry is facing an impending major liquidity test.

AI Trading Faces a "Vulnerable Moment"! Japan and South Korea Stock Markets Experience "Black Tuesday" as SK Hynix, Samsung, and SoftBank Plunge Together
On Tuesday, Asian tech stocks faced a new round of systemic sell-off as the overnight weakness in the US semiconductor sector spread to the Asia-Pacific market. Concerns intensified over increasingly fierce competition due to the technological breakthrough by Chinese memory chip manufacturer ChangXin Memory Technologies, as well as worries about the returns on AI capital expenditure and the overall financing environment.
Crypto prices
More


