
Toncoin (TON) Price Prediction for August 17, 2025: Will TON Break $3.55 To Challenge $3.70 Resistance?

The price of Toncoin is currently around $3.49, which is a strong level after it fell to a low of $3.14 earlier this month. On the daily chart, TON has been coiling inside a wide accumulation structure. Smart money concepts like BOS and CHoCH show that buyers are slowly gaining control. There is a lot of demand in the $2.90–$3.00 range, and the fact that it keeps getting rejected from $3.70 shows that this is the next big resistance zone.

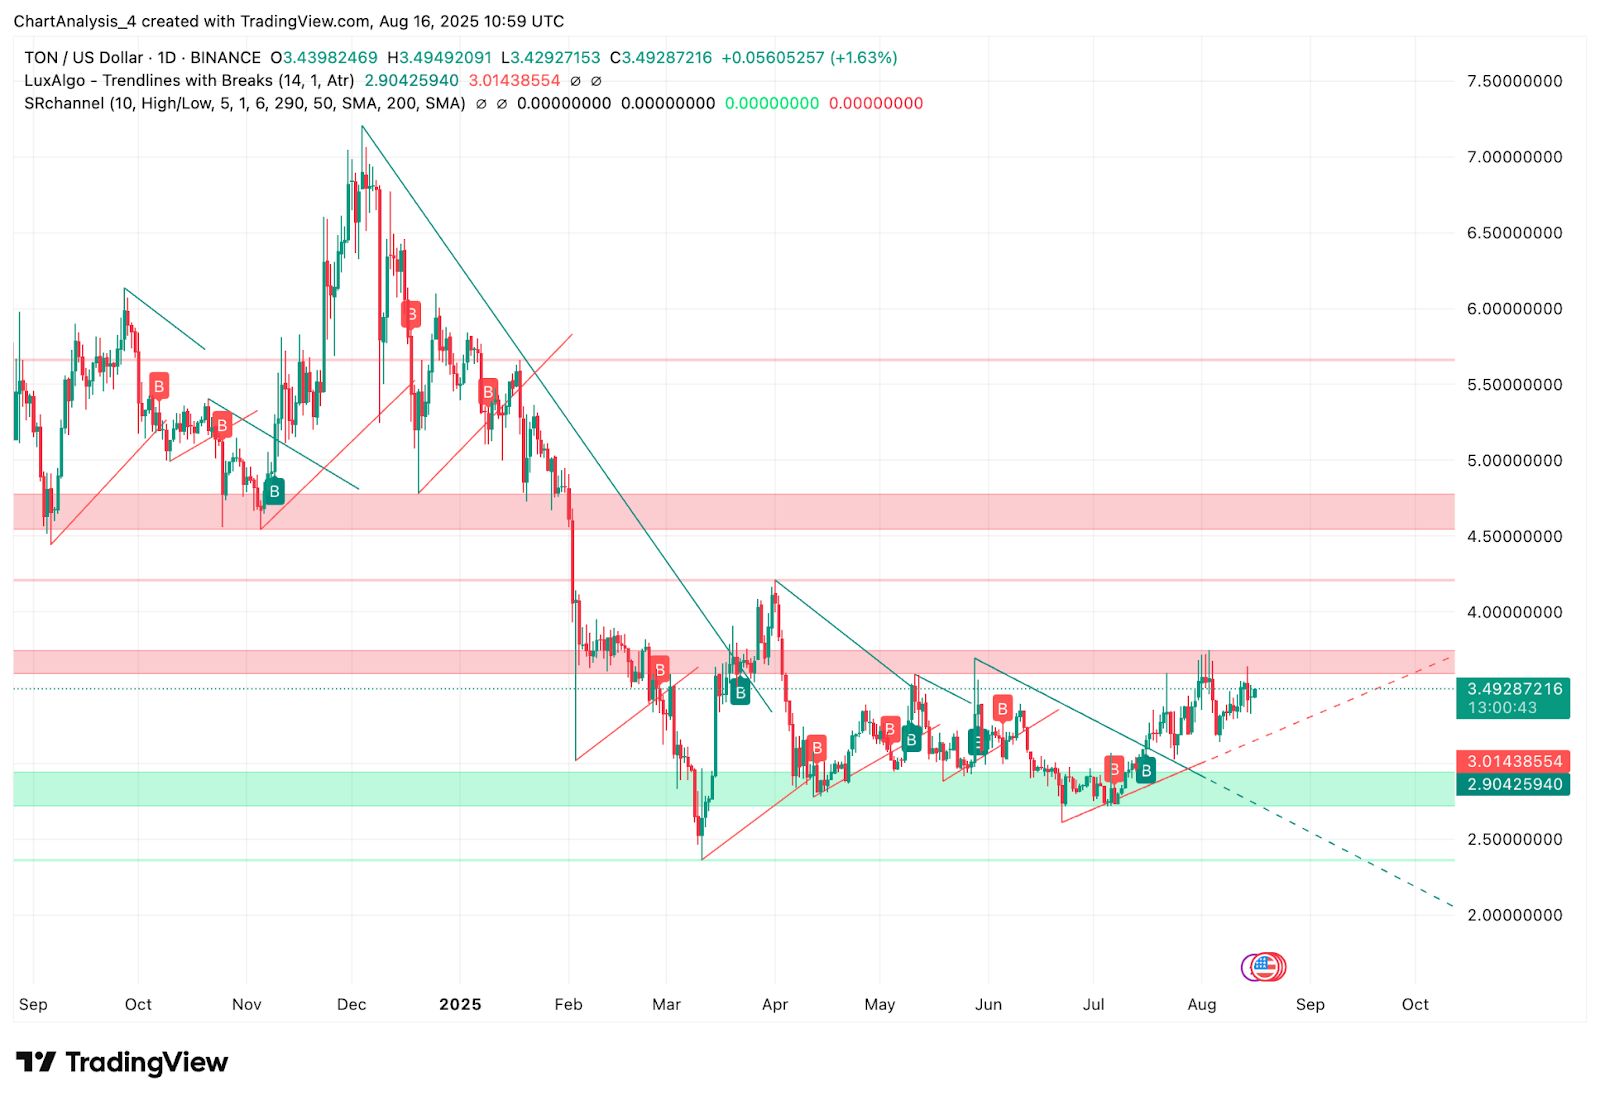
TON has broken out of its broader downtrend from March lows and is now trading above the diagonal trendline resistance. This structural change, together with consistent higher lows since July, suggests strengthening bullish intent.
Why Is The Toncoin Price Going Up Today?
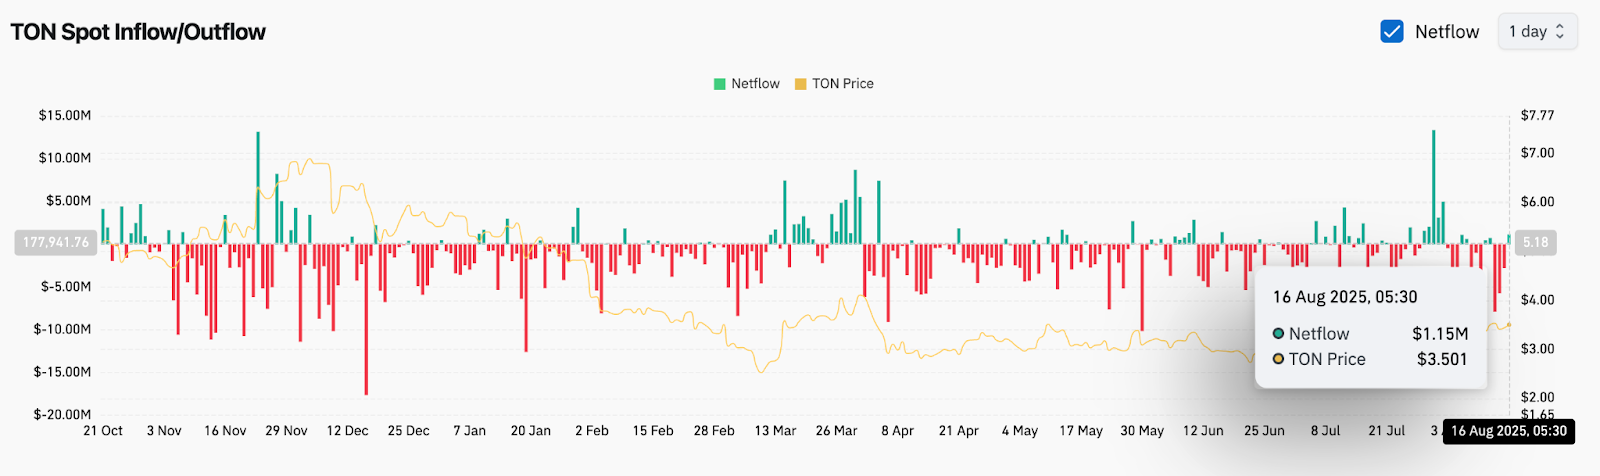
One reason why the Toncoin price going up today lies in improving liquidity flows. Exchange data shows a positive net inflow of $1.15M on August 16, coinciding with TON’s climb toward $3.50. This indicates renewed market participation on the buy side.
On the intraday chart, TON is pressing against the $3.55 resistance after reclaiming the 0.5 Fibonacci retracement level at $3.44. The Parabolic SAR dots have flipped below price, confirming a short-term bullish bias.
Bollinger Bands, EMAs, and Market Momentum
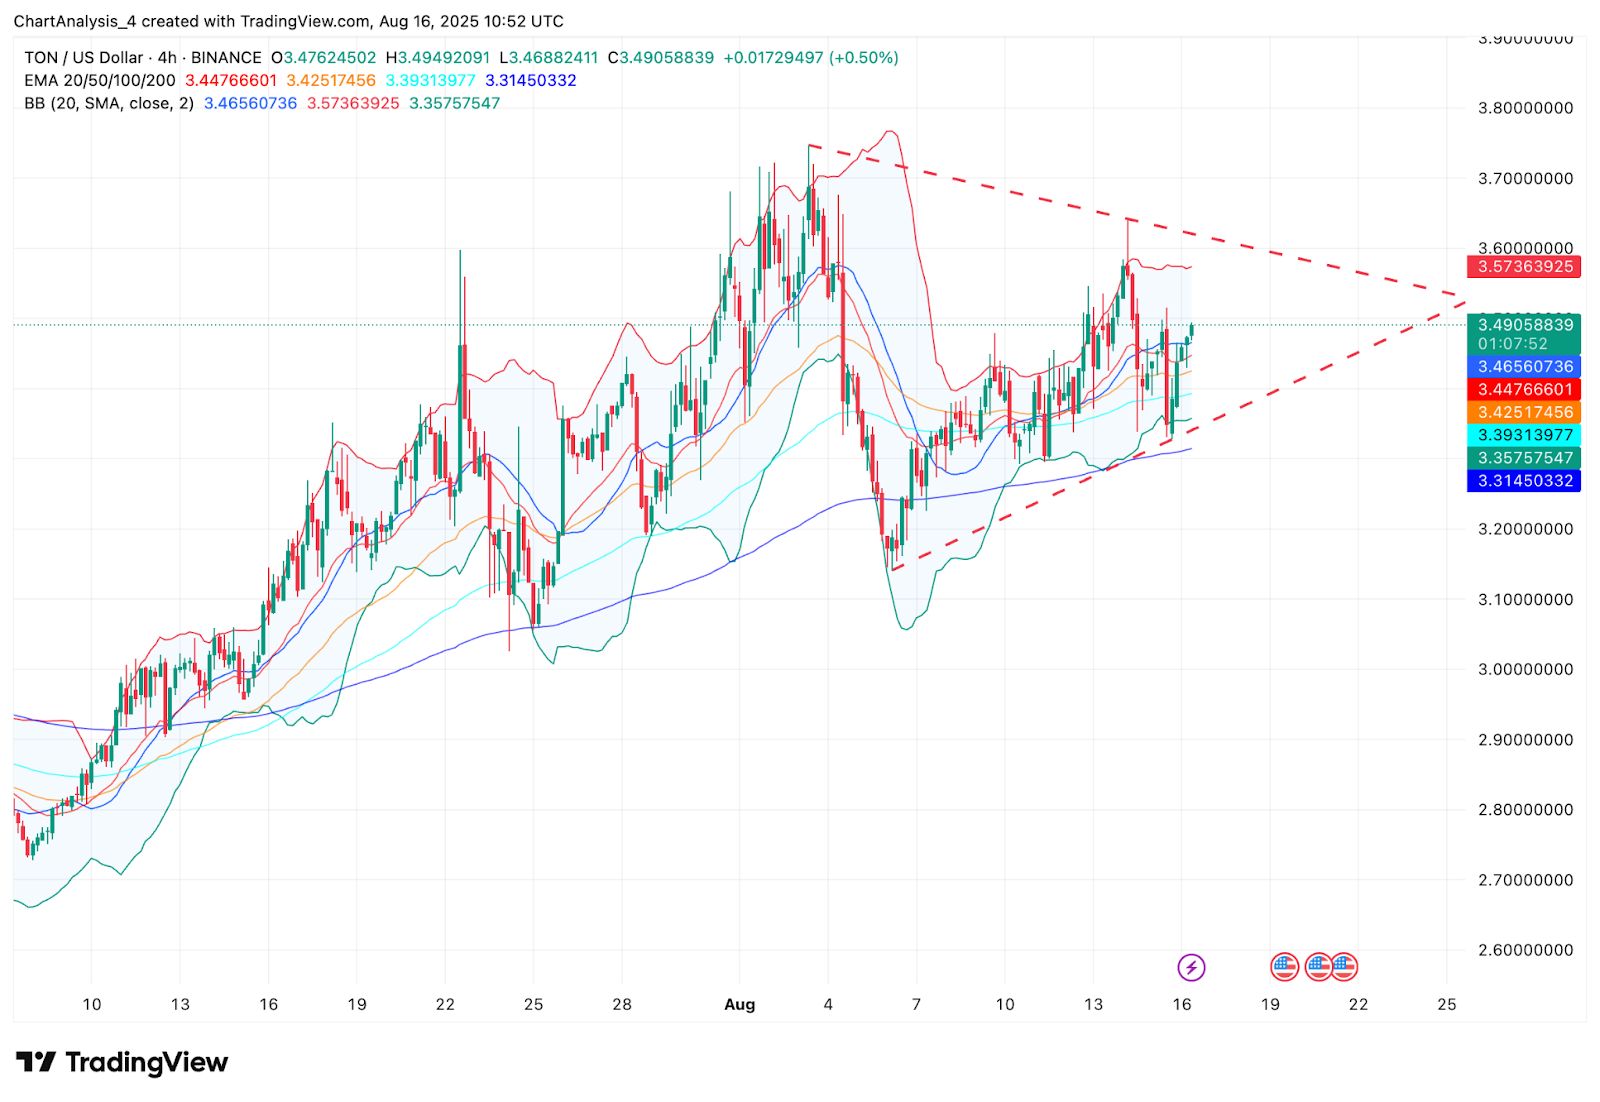
The 4-hour chart shows Bollinger Bands contracting, with TON now attempting a squeeze breakout. Price is holding above the 20, 50, and 100 EMA cluster between $3.31 and $3.44, showing that the dynamic moving averages are now acting as support. The 200 EMA at $3.39 is also aligned below current levels, adding further stability.
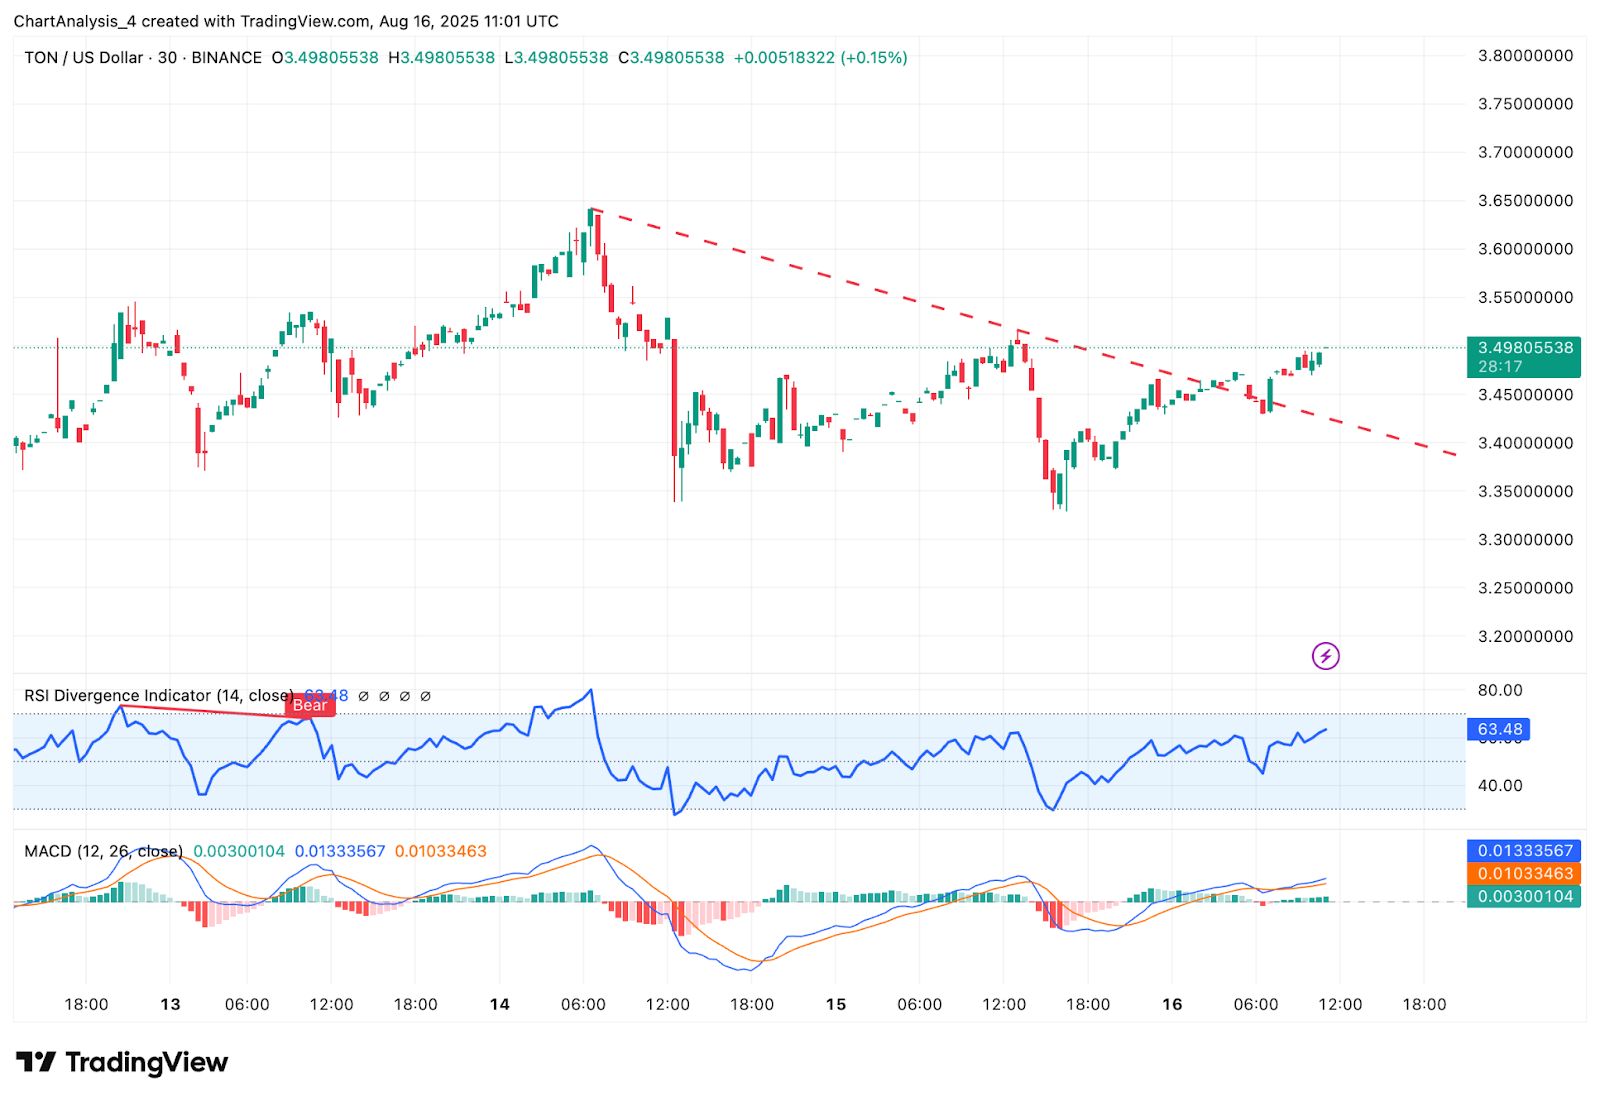
Momentum indicators confirm the bullish tilt. The RSI on the 30-minute chart is at 63, staying just below overbought levels but signaling firm demand. MACD has completed a bullish crossover, with the histogram building upward momentum.
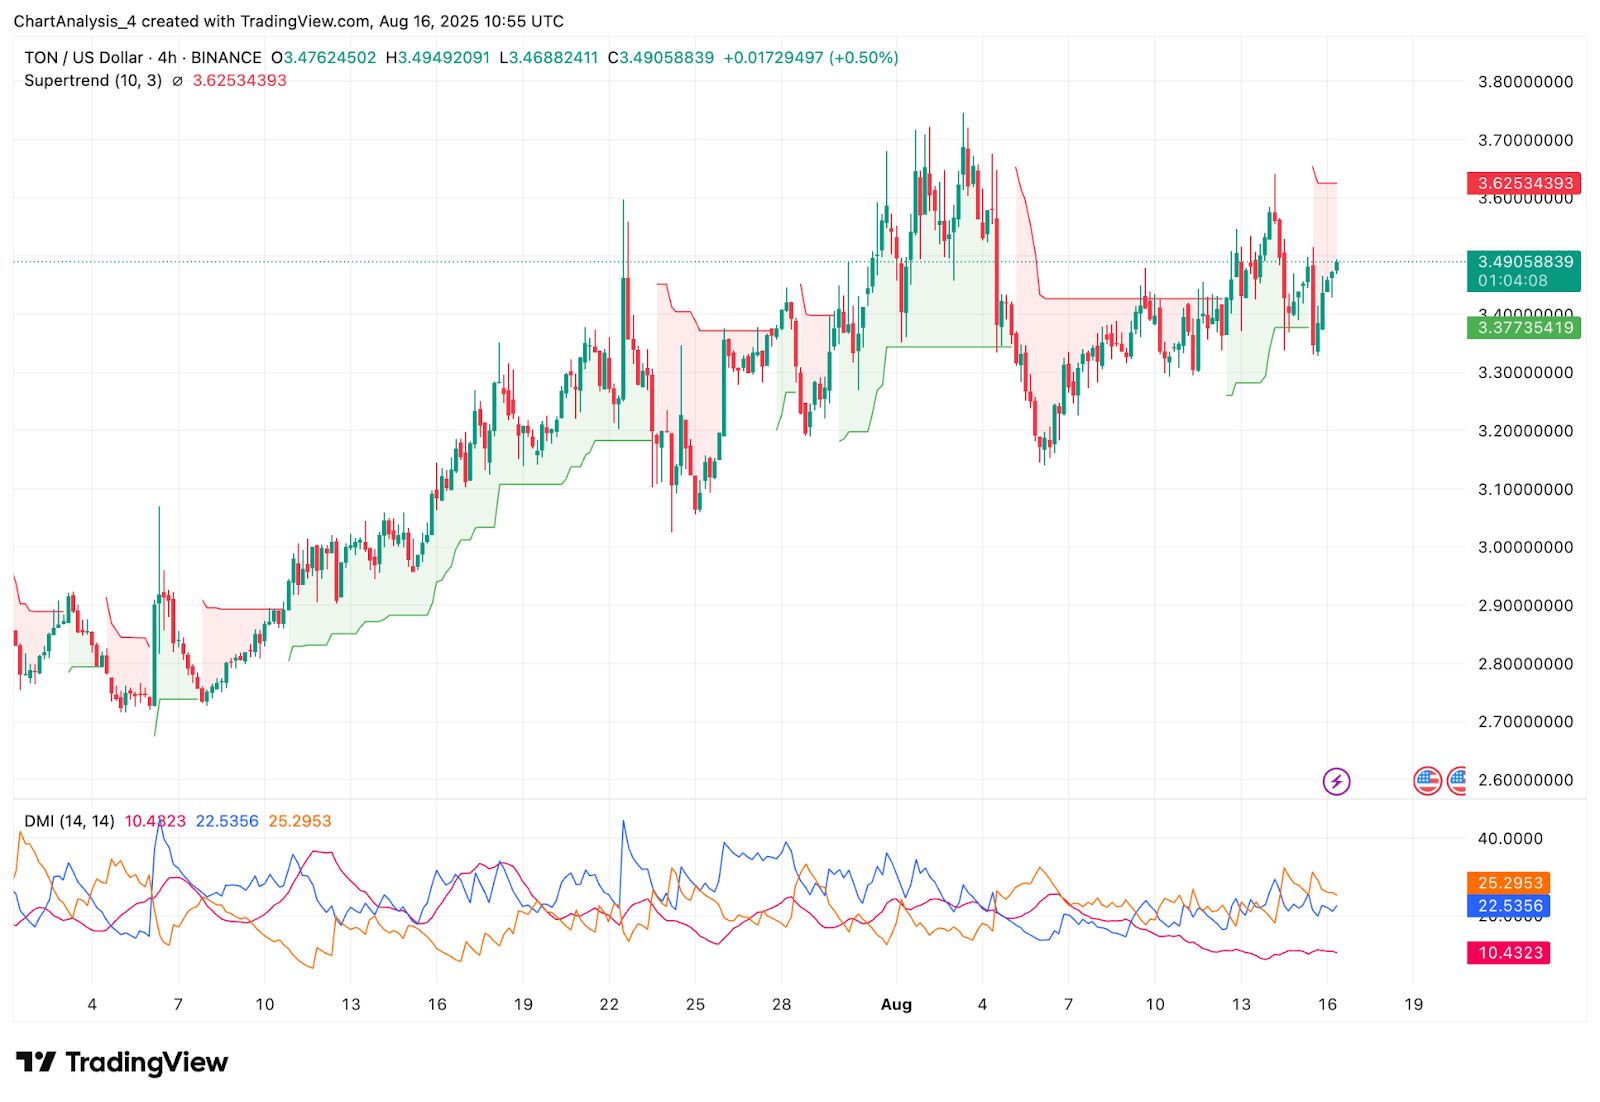
Directional Movement Index (DMI) shows the +DI leading above the -DI, while ADX remains steady, indicating a developing trend. Meanwhile, the Supertrend indicator has shifted into a green zone after last week’s correction, providing additional support for upward continuation.
Toncoin Price Prediction: Short-Term Outlook (24H)
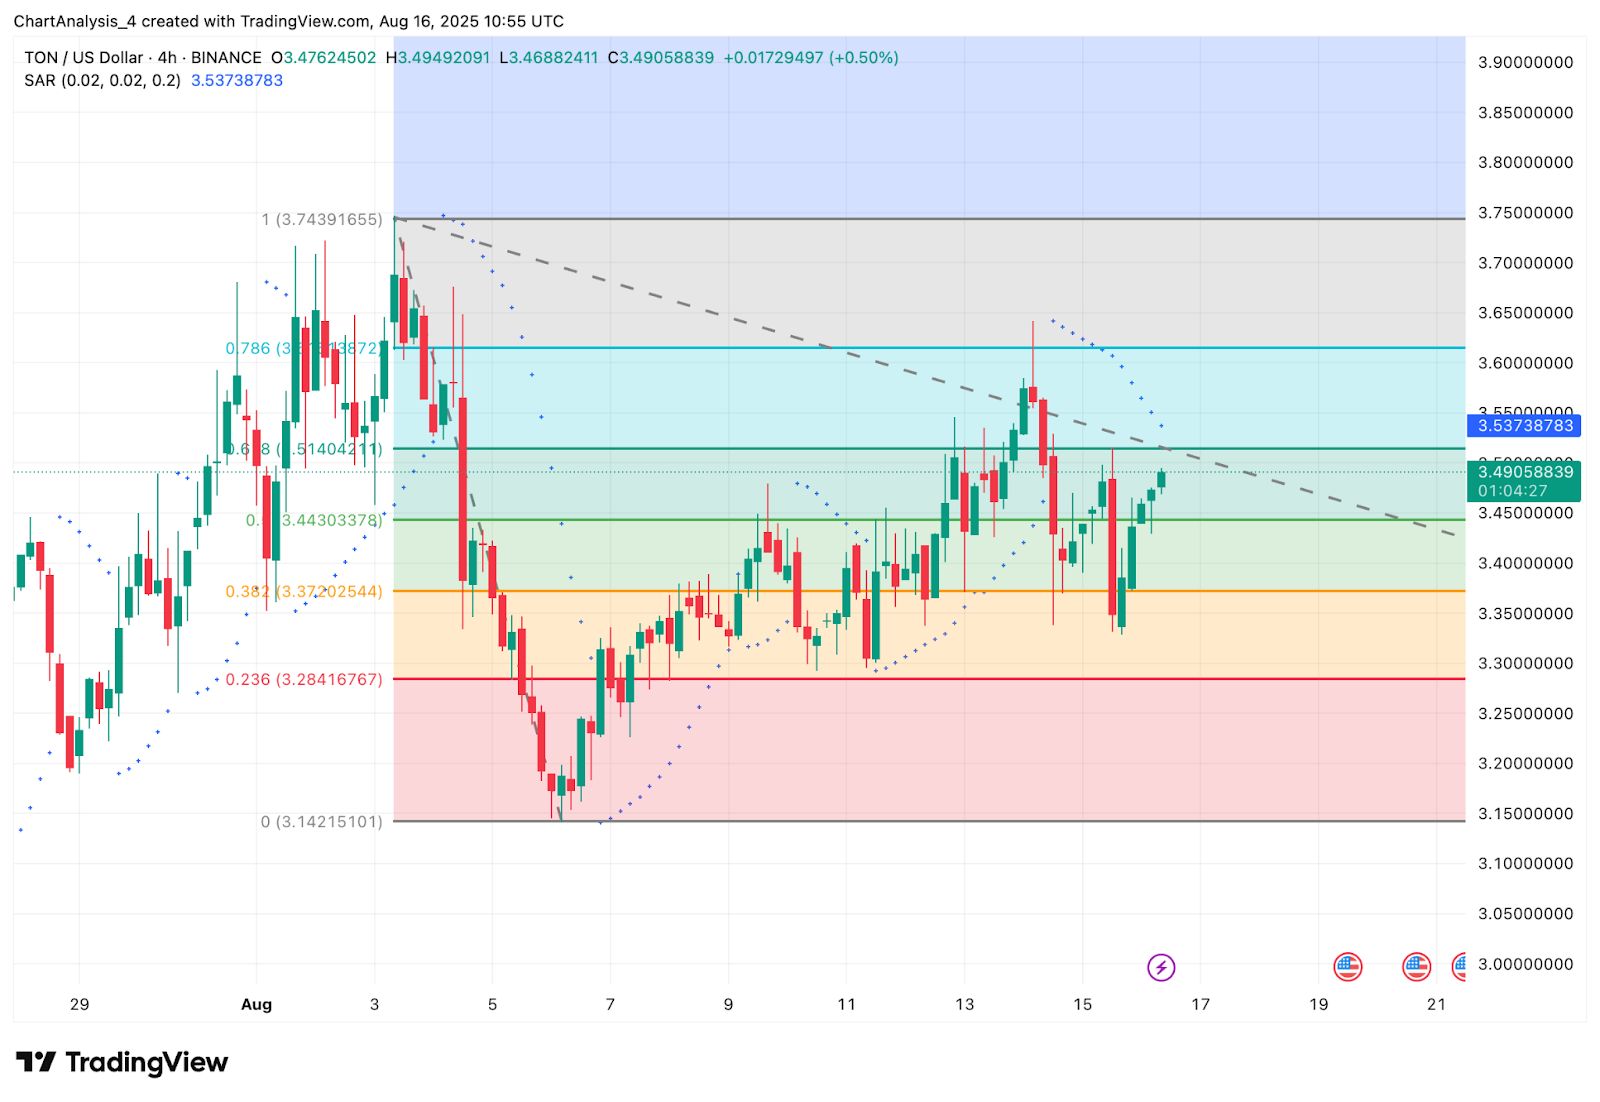
In the near term, the price action of Toncoin is poised to pivot between $3.55 and $3.60. A breakout above this level with volume confirmation could open the path toward $3.70, followed by $3.85. Beyond that, the next supply zone lies closer to $4.00.
On the downside, failure to close above $3.55 may result in another pullback toward $3.44 and potentially $3.37, the 0.382 Fib retracement. A deeper decline would retest the $3.25 to $3.30 support zone, where previous demand re-emerged.
Overall, with EMAs stacked below price, bullish crossovers in momentum indicators, and liquidity data improving, Toncoin appears positioned for an upside attempt. Traders should watch the $3.55 breakout zone closely.
Toncoin Price Forecast Table: August 17, 2025
| Indicator/Zone | Level / Signal |
| Toncoin price today | $3.49 |
| Resistance 1 | $3.55 |
| Resistance 2 | $3.70 |
| Support 1 | $3.44 |
| Support 2 | $3.30 |
| EMA Cluster (20/50/100/200, 4H) | $3.31–$3.44, stacked bullish |
| RSI (30-min) | 63.4 (bullish momentum) |
| MACD (30-min) | Bullish crossover |
| Parabolic SAR (4H) | Bullish, dots below price |
| Supertrend (4H) | Flipped bullish near $3.38 |
| Liquidity Netflow (Aug 16) | +$1.15M inflow, bullish signal |
Disclaimer: The content of this article solely reflects the author's opinion and does not represent the platform in any capacity. This article is not intended to serve as a reference for making investment decisions.
You may also like
Musk on chip production: China's large-scale manufacturing capacity often exceeds the sum of all other regions worldwide
After ChangXin Memory Technologies announced a key breakthrough in DDR5 server memory, the Philadelphia Semiconductor Index in the US stock market fell 2.7% overnight, with shares such as Micron and SK Hynix ADR dropping collectively. Musk commented on this trend, saying that when China figures out the manufacturing method of a product, its ability to scale production often exceeds that of the rest of the world combined, and stated that "China seems to be rapidly conquering" general standard specifications such as LP5 and LP6.

IREN reports $702.6 million net loss despite $4 billion in AI cloud contracts
The current AI frenzy: featuring both "Tech and Internet" and "Real Estate" bubble characteristics, reminiscent of the 2008 global capital cycle
This wave of the AI boom exhibits dual characteristics: On a micro level, the heavy-asset nature of AI data centers is driving the industry toward "real estate-like" debt financing models, such as corporate bonds, private credit, and computing power ABS. On a macro level, nearly $2 trillion in overseas excess savings is flowing into core AI assets in the U.S. stock market through private institutions, reconstructing a transnational capital cycle reminiscent of the period before the 2008 subprime mortgage crisis. With nearly $3 trillion in off-balance sheet debt and rising interest rates, the industry is facing an impending major liquidity test.

AI Trading Faces a "Vulnerable Moment"! Japan and South Korea Stock Markets Experience "Black Tuesday" as SK Hynix, Samsung, and SoftBank Plunge Together
On Tuesday, Asian tech stocks faced a new round of systemic sell-off as the overnight weakness in the US semiconductor sector spread to the Asia-Pacific market. Concerns intensified over increasingly fierce competition due to the technological breakthrough by Chinese memory chip manufacturer ChangXin Memory Technologies, as well as worries about the returns on AI capital expenditure and the overall financing environment.
Crypto prices
More


