Ethereum’s Rally Stalls—But the Bigger Picture Still Looks Strong
Ethereum’s recent climb has slowed a bit, dipping just under $4,500 after what felt like an unstoppable run. It’s not exactly a crash—more like catching its breath. But if you’re watching the charts, there’s still a chance things could pick up again before the month ends.
The Ethereum Rainbow Chart, which plots long-term price trends in colorful bands, hints at where things might go next. It’s not a crystal ball for day-to-day swings, but it gives a rough idea of whether ETH is priced too high, too low, or just about right. Right now, it’s sitting in what the chart calls the “Steady” zone—basically, fair value.
What the Rainbow Chart Says About ETH’s Future
The model lays out nine possible price ranges for August 31, 2025. At the bottom, there’s the “Fire Sale” tier ($899–$1,217), followed by “Undervalued” and “Accumulate”—the kind of prices that make traders wish they’d bought more. Then there’s “Still Cheap” ($2,359–$3,355), which, let’s be honest, doesn’t feel all that cheap anymore.
The “Steady” range, where ETH is now, sits between $3,355 and $4,832. If it stays here, the chart suggests the market’s pricing it fairly—no wild overreaction, no panic selling. But if it climbs into the “HODL!” or “Is this The Flippening?” bands ($7,015–$10,200), things could get interesting. Or, you know, stressful.
At the very top? “Maximum Bubble Territory,” a zone between $14,581 and $20,778 where logic might start to take a backseat. We’re not there yet, obviously.
Where ETH Stands Right Now
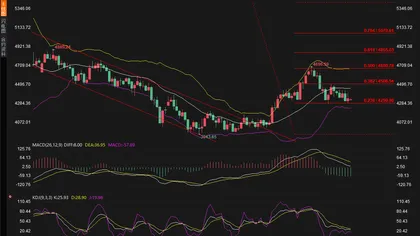
As of today, Ethereum’s hovering around $4,442—down slightly (0.15%) in the last day but still up 4.5% for the week. Not bad, considering how volatile crypto can be.
The 50-day and 200-day moving averages—$3,413 and $2,596, respectively—are way below the current price, which usually means the trend is still bullish. And the Relative Strength Index (RSI) is at 66.86, edging toward overbought territory. That could mean more upside, or it might signal a small pullback if buyers get too eager.
So, what’s next? Hard to say. The Rainbow Chart suggests ETH isn’t overextended yet, but crypto has a habit of surprising everyone. For now, it’s holding steady—and that’s not the worst place to be.
*Featured image via Shutterstock*