
SEI Price Set to Rally as Bullish EMA Crossover Signals Breakout

SEI’s 100-day EMA is about to cross above the 200-day EMA. Combined with weekly outflows and short liquidations stacked, SEI’s price could be primed for a continuation rally. But one cohort of traders may get burned.
Despite broader market weakness, SEI, the native token of Sei blockchain, has stayed in uptrend mode, rising over 45% in three months and gaining 6.3% in the past week.
The SEI rally could extend further, as a key bullish pattern emerges and exchange flows signal sustained accumulation. However, one trading cohort may be sitting in danger if prices keep climbing.
SEI Exchange Outflows Continue for the 8th Straight Week
SEI has been consistently pulled off exchanges for eight consecutive weeks. Last week alone, SEI saw net outflows of $10.43 million, marking the second-largest weekly total since July’s peak. These continuous outflows reflect rising buying pressure and long-term conviction.
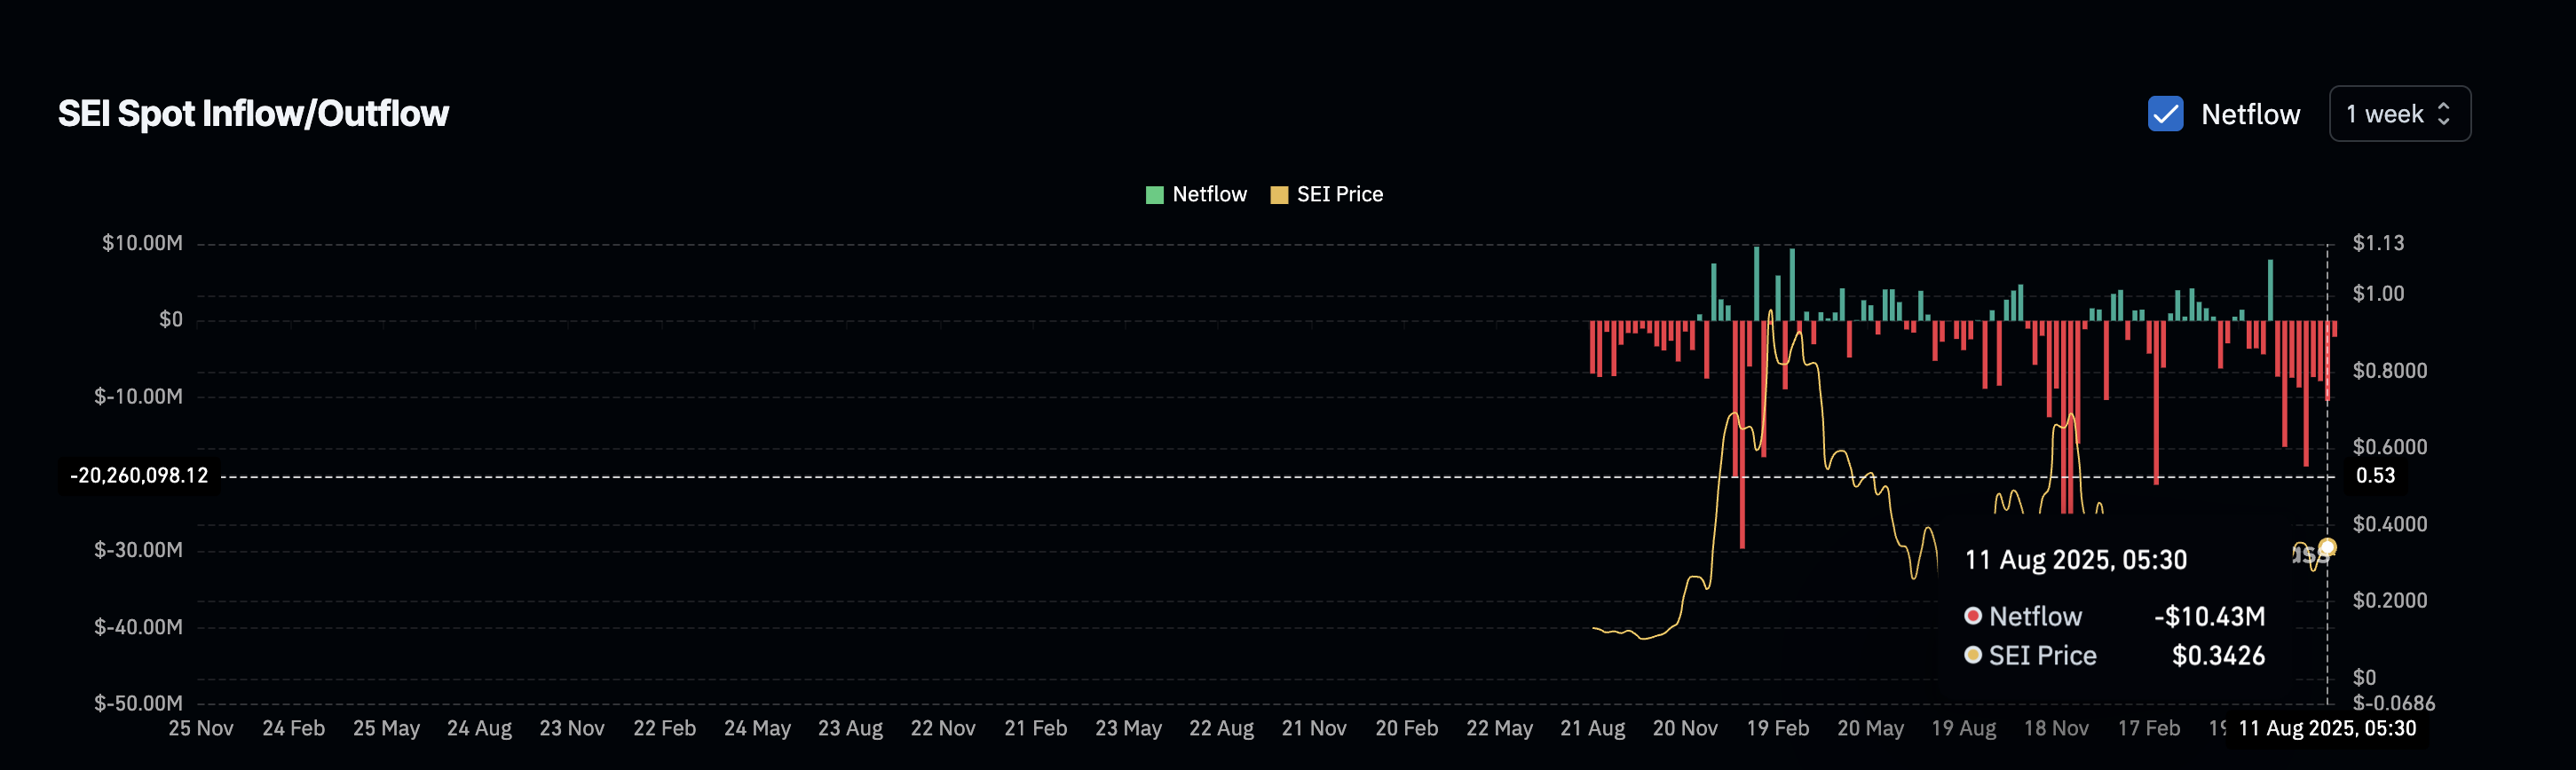 SEI price and rising outflows:
SEI price and rising outflows
SEI price and rising outflows:
SEI price and rising outflows
This demand uptick coincides with Sei’s recent push into institutional-grade offerings. The launch of Monaco, Sei’s Wall Street-grade trading layer, and the CBOE’s ETF filing have sparked fresh interest among big-ticket players.
Combined with a massive rise in active addresses and the total value locked nearing $626 million, the on-chain fundamentals continue to back the price trend.
Bullish Crossover Forms as Shorts Load Up
On the daily chart, SEI is now flashing a classic bullish signal. The 100-day EMA or Exponential Moving Average is about to cross above the 200-day EMA, a move typically viewed as a medium-term buy trigger. If confirmed, this crossover could accelerate the ongoing uptrend.
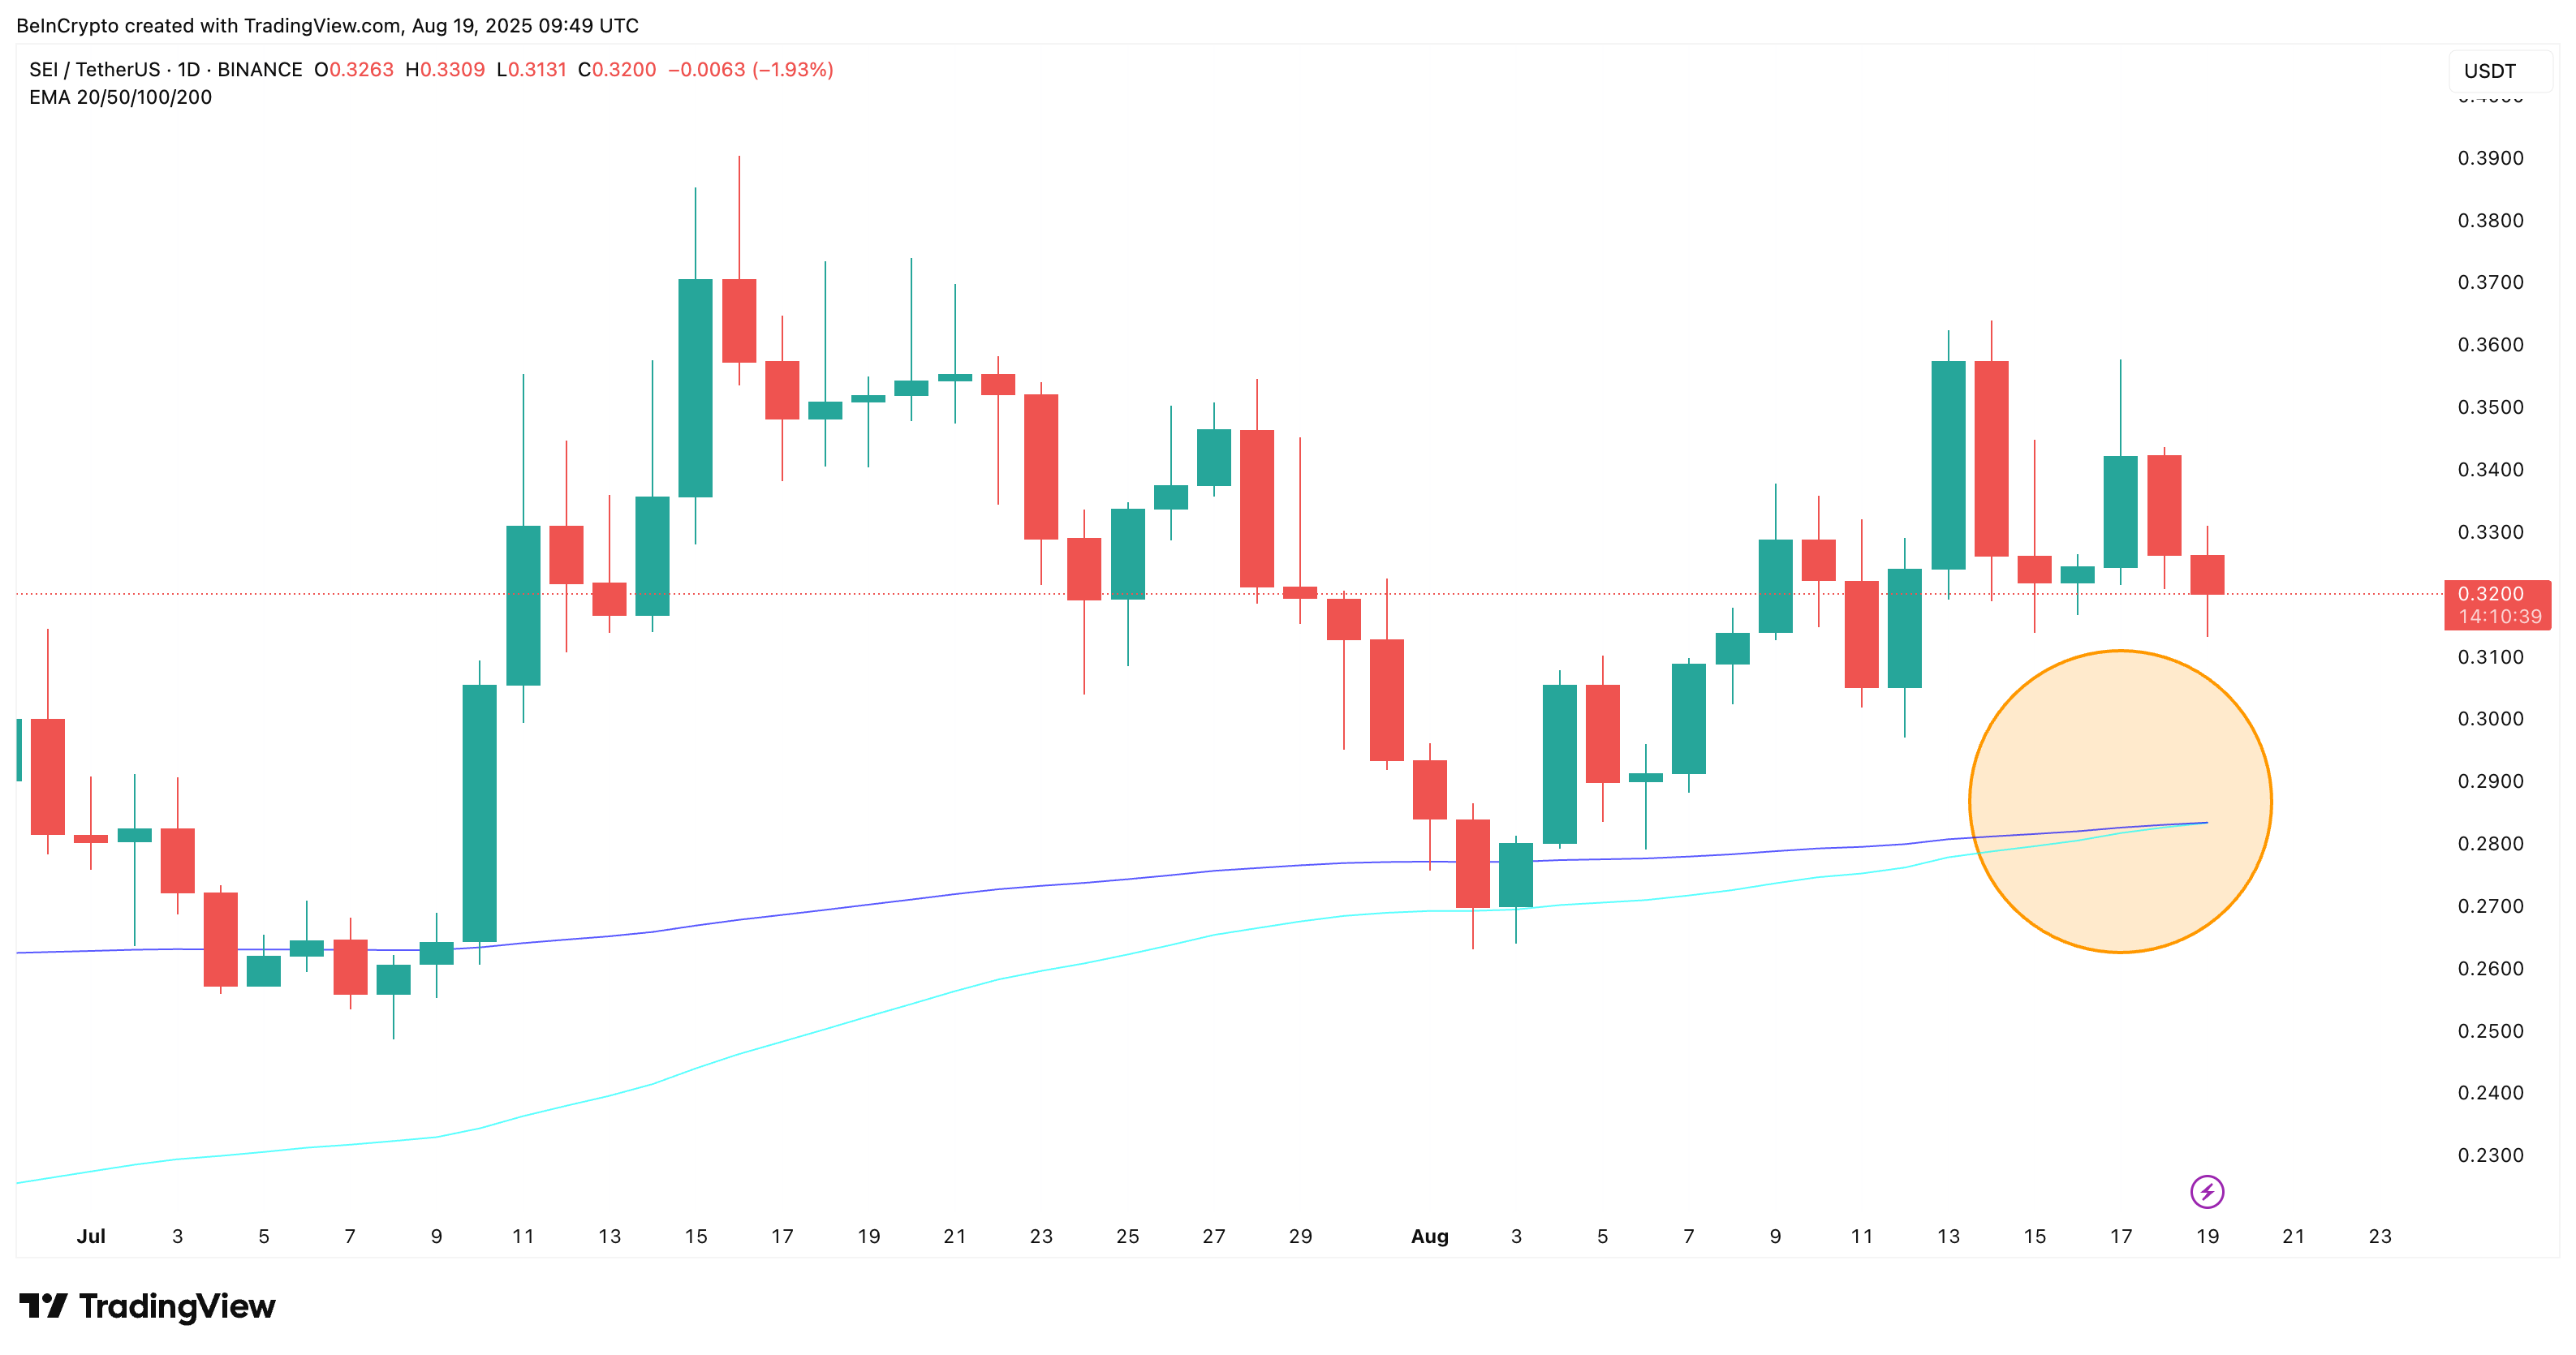 Bullish SEI price crossover is on the cards:
Bullish SEI price crossover is on the cards
Bullish SEI price crossover is on the cards:
Bullish SEI price crossover is on the cards
EMA stands for Exponential Moving Average — a trend-following indicator that gives more weight to recent prices. A crossover happens when a shorter EMA (say, 100-day) moves above or below a longer one (like the 200-day), often hinting at a shift in market momentum.
Institutional and long-term swing traders use the 100-day/200-day crossover as a confirmation of a more reliable uptrend.
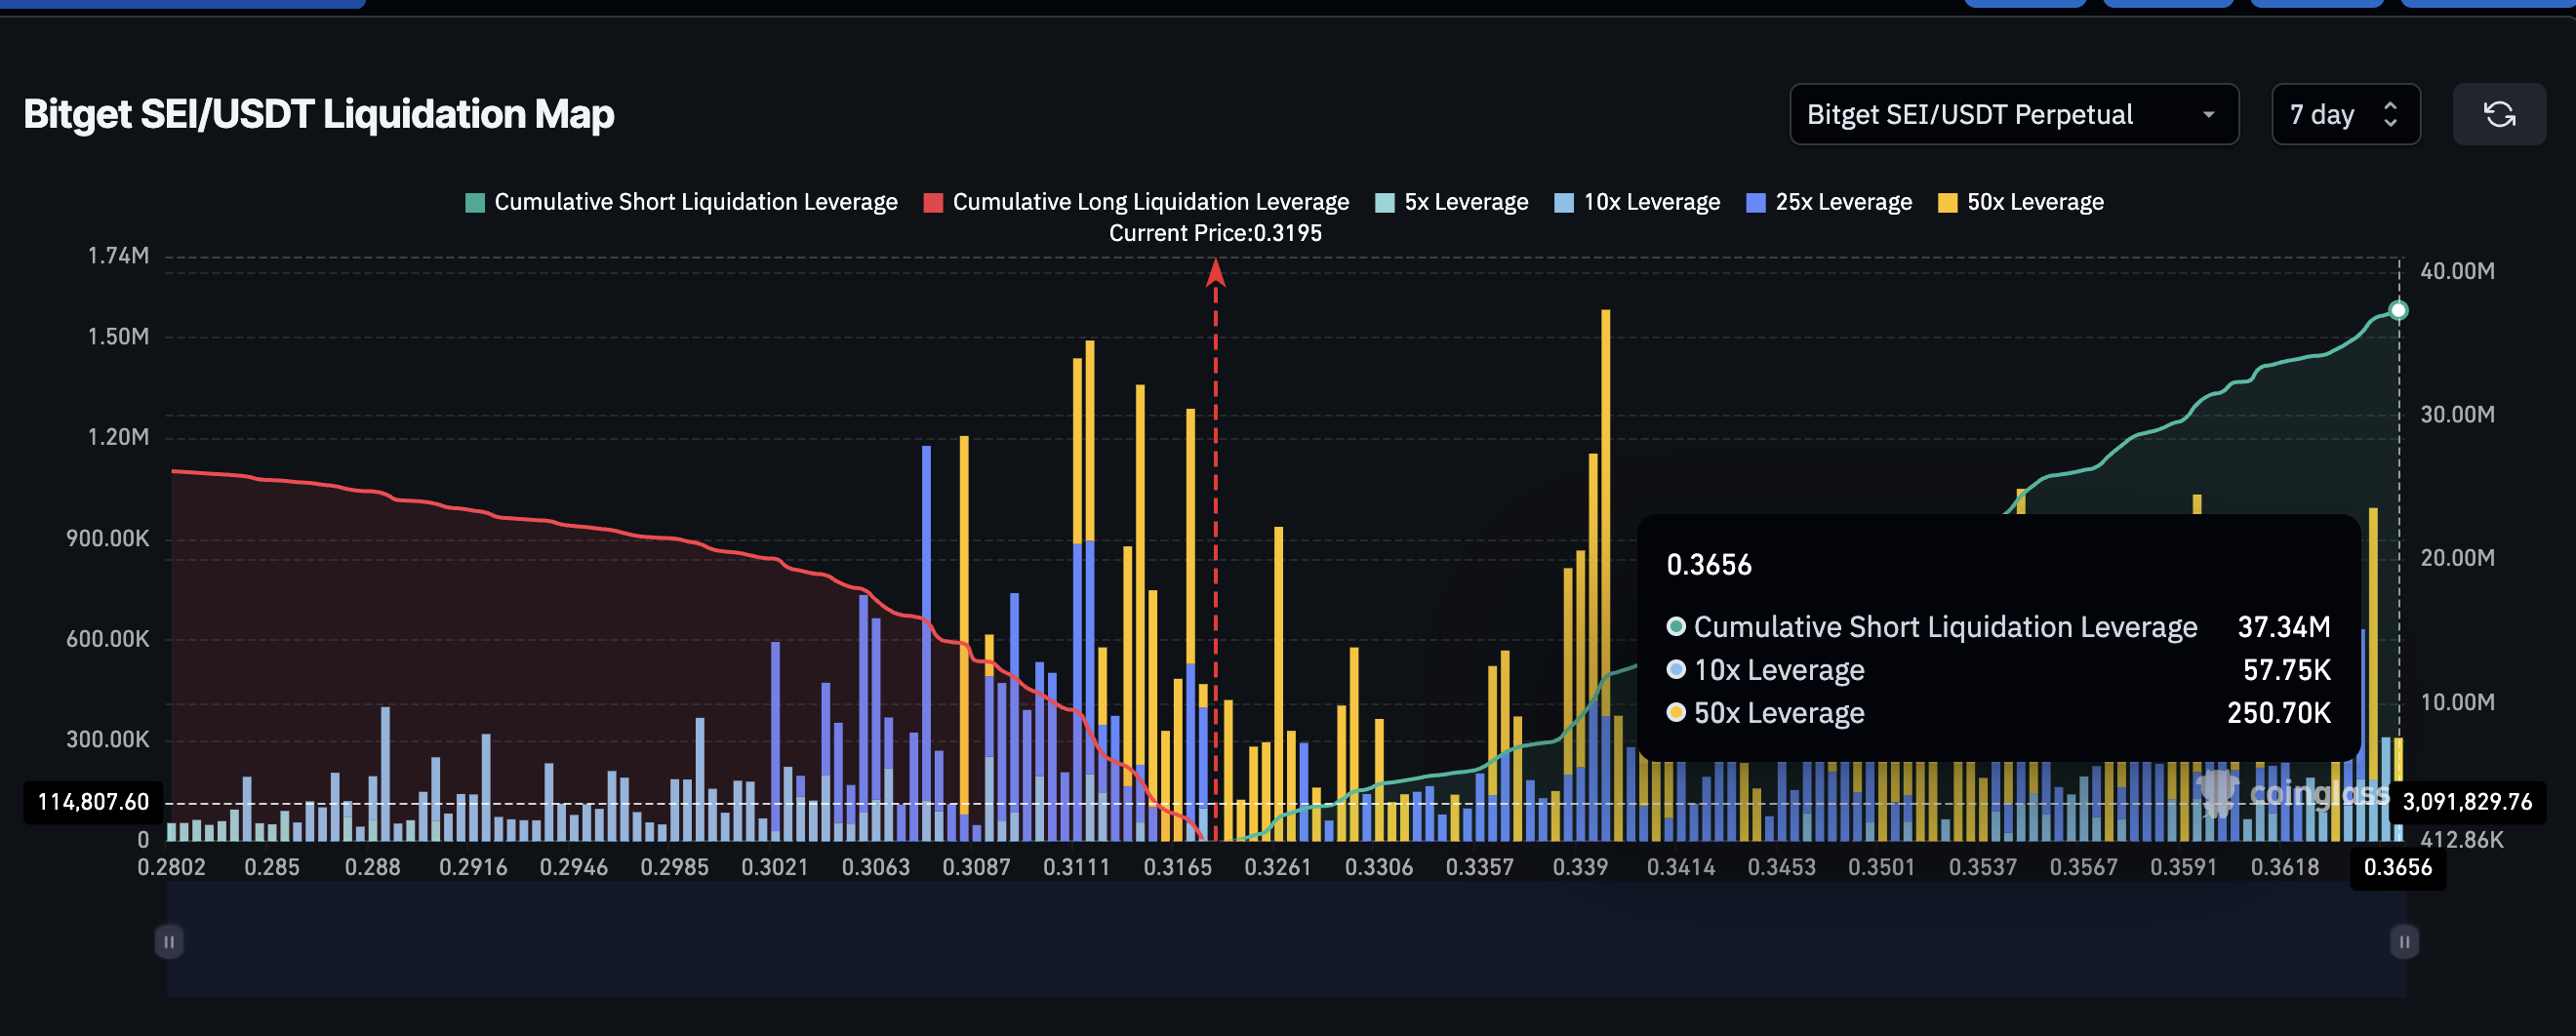
That’s where the risk to bears comes in. Over the past 7 days, $37.34 million in short positions have built up on Bitget alone, compared to $26.15 million in longs.
 SEI liquidation map:
SEI liquidation map
SEI liquidation map:
SEI liquidation map
Liquidation maps reveal that many of these short trades are stacked around $0.32 to $0.36. If the bullish crossover fuels a quick price rise, those short positions could face cascading liquidations, pushing SEI higher in a short squeeze.
A short squeeze happens when traders betting against a token are forced to buy it back at higher prices, pushing the price up even more.
SEI Price Needs to Beat $0.35 to Open Room to $0.37
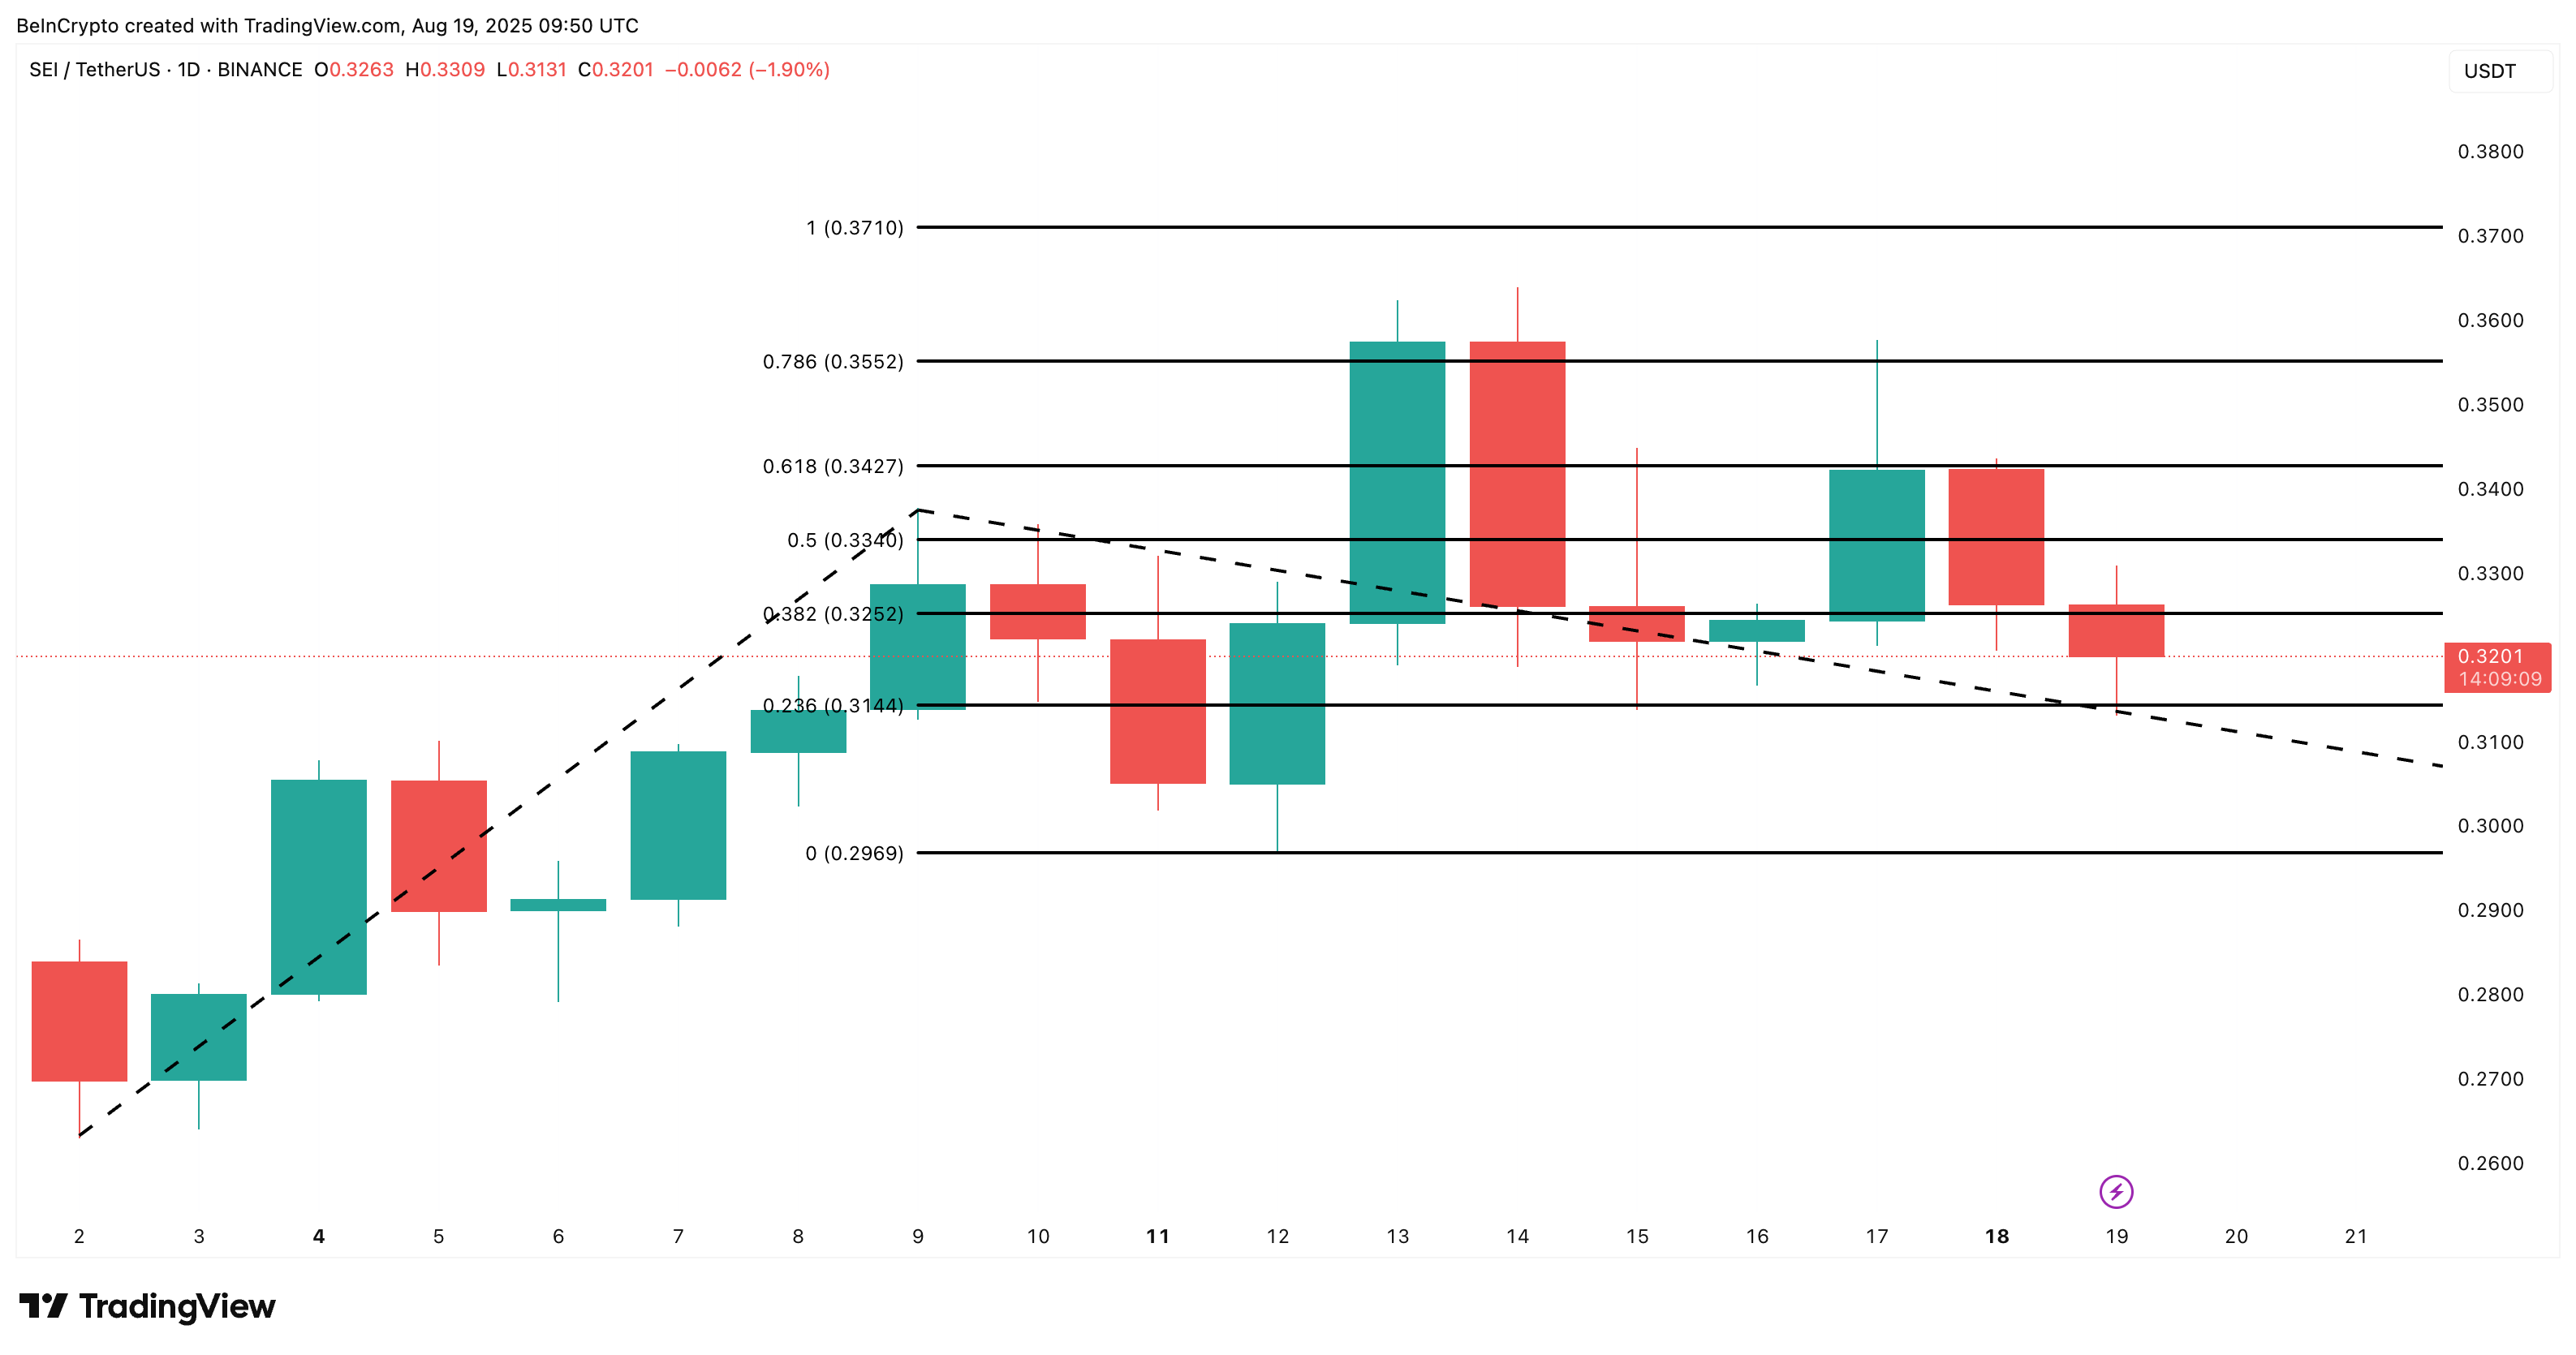
SEI is currently trading near $0.32, just above the local support of $0.31. This range has acted as a consistent buy zone for bulls. To confirm the continuation of its rally, SEI must cleanly break through $0.35, a level where it was previously rejected multiple times.
If this level flips, $0.37 becomes the next likely resistance.
 SEI price analysis:
SEI price analysis
SEI price analysis:
SEI price analysis
Given the macro momentum, bullish EMAs, and consistent exchange outflows, the price structure remains tilted to the upside. However, any failure to flip $0.35 could give trapped shorts a temporary breather before bulls reload.
Also, if the SEI price dips under $0.31 and tests $0.29, the short-term bullish trend might not hold.
Disclaimer: The content of this article solely reflects the author's opinion and does not represent the platform in any capacity. This article is not intended to serve as a reference for making investment decisions.
You may also like
Navi Microelectronics (NVTS.US) releases 24kW power board: The reality and expectations behind the heating up of the 800V narrative
On October 13, Navitas Semiconductor and Nvidia jointly unveiled a 24kW, 800V-to-12V DC-DC power supply board, which is scheduled to be showcased at the Nvidia MGX ecosystem exhibition area during the OCP Global Summit.

UnitedHealth (UNH.US) Q3 earnings report about to be released: Options betting on 6.5% stock price volatility, strategists suggest "sell short, buy long" to reduce costs
UnitedHealth (UNH.US) will release its Q3 financial report before the U.S. stock market opens on Tuesday. The options market expects the stock price to fluctuate by 6.5% around the earnings announcement.
SpaceX (SPCX.US) Eyes Mid-band Spectrum, AST SpaceMobile (ASTS.US) Spectrum Moat Faces Threat
ASTS faces threats from Starlink: Analysts say Musk may combine Ligado, Viasat, and FCC spectrum to carry out a "large-scale" mid-band blockade.
Crypto prices
More


