

Date: Tue, Aug 19, 2025 | 06:50 AM GMT
The cryptocurrency market is experiencing notable selling pressure as Ethereum (ETH) slips back to $4,250 from its recent high of $4,780. This weakness has extended to several major altcoins .
Yet, despite the broader pullback, Bio Protocol (BIO) has managed to remain resilient, posting a 10% gain on the day and extending its monthly rally to over 100%. Adding to the bullish case, BIO’s chart is now highlighting a harmonic formation that suggests further upside could be on the horizon.
 Source: Coinmarketcap
Harmonic Pattern Hints at Potential Bounce
On the 4-hour chart, BIO is forming a Bearish ABCD harmonic pattern. While technically labeled as bearish, this setup usually involves a strong bullish CD-leg rally before the Potential Reversal Zone (PRZ) becomes relevant.
The structure began with a rally from Point A near $0.0559 to Point B, before BIO retraced to Point C around $0.0956, where buyers re-entered with conviction. Since then, the token has surged higher and is currently trading near $0.1380, with price action confirming the unfolding of the CD leg.
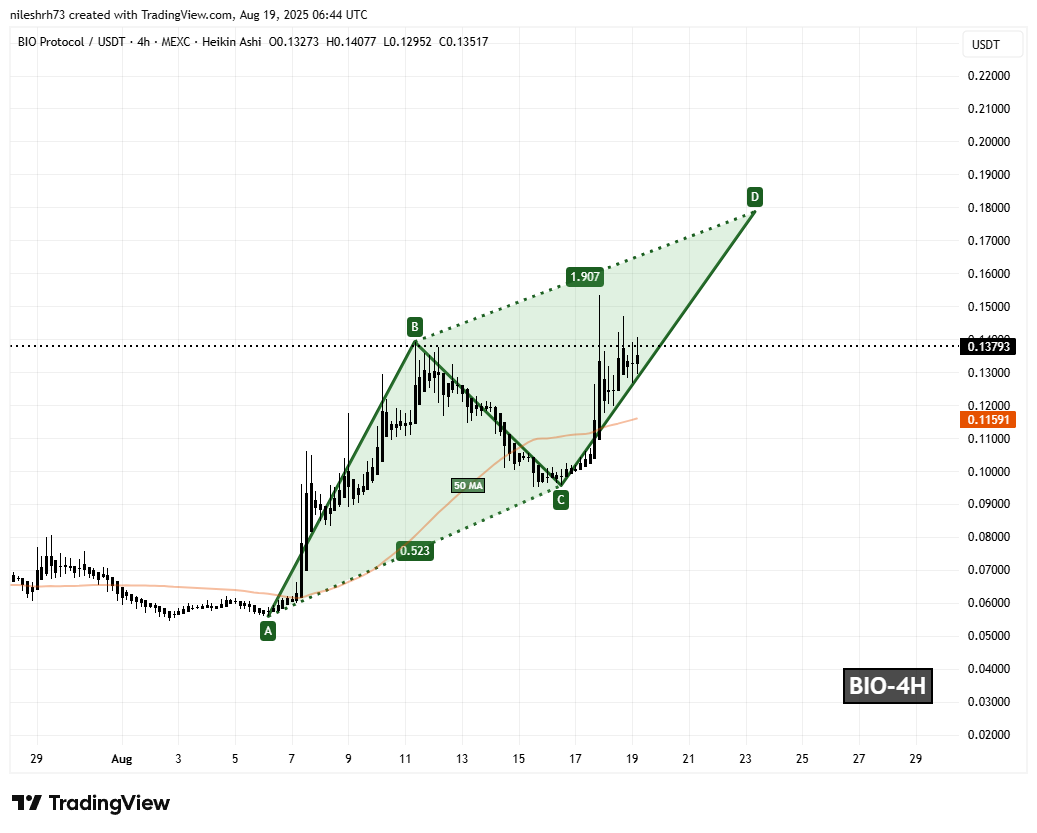 Bio Protocol (BIO) Daily Chart/Coinsprobe (Source: Tradingview)
The 1.90 Fibonacci extension of the BC leg projects Point D near $0.1787, marking a key upside target that traders are closely eyeing as the next potential resistance zone.
What’s Next for BIO?
If bullish momentum continues, BIO could push toward the $0.1787 PRZ, a level that could serve as both a profit-taking zone and a test of market strength. Historically, harmonic patterns often encounter heavy resistance at these completion zones, leading to either consolidation or a corrective pullback.


