
Ethereum Leaves Bitcoin Behind as ETF Inflows and Bullish Bets Build

Ethereum is outshining Bitcoin as ETF inflows surge past $1.8 billion, fueling bullish sentiment and lifting ETH’s price outlook.
Leading altcoin Ethereum is showing stronger momentum than Bitcoin (BTC) this week, driven by rising inflows into ETH-backed exchange-traded funds (ETFs).
According to on-chain data, ETH ETFs have attracted more capital than their BTC counterparts, which could improve the altcoin’s price performance in the near term.
Ethereum ETF Inflows Hit $1.8 Billion, Outpacing Bitcoin’s $388 Million
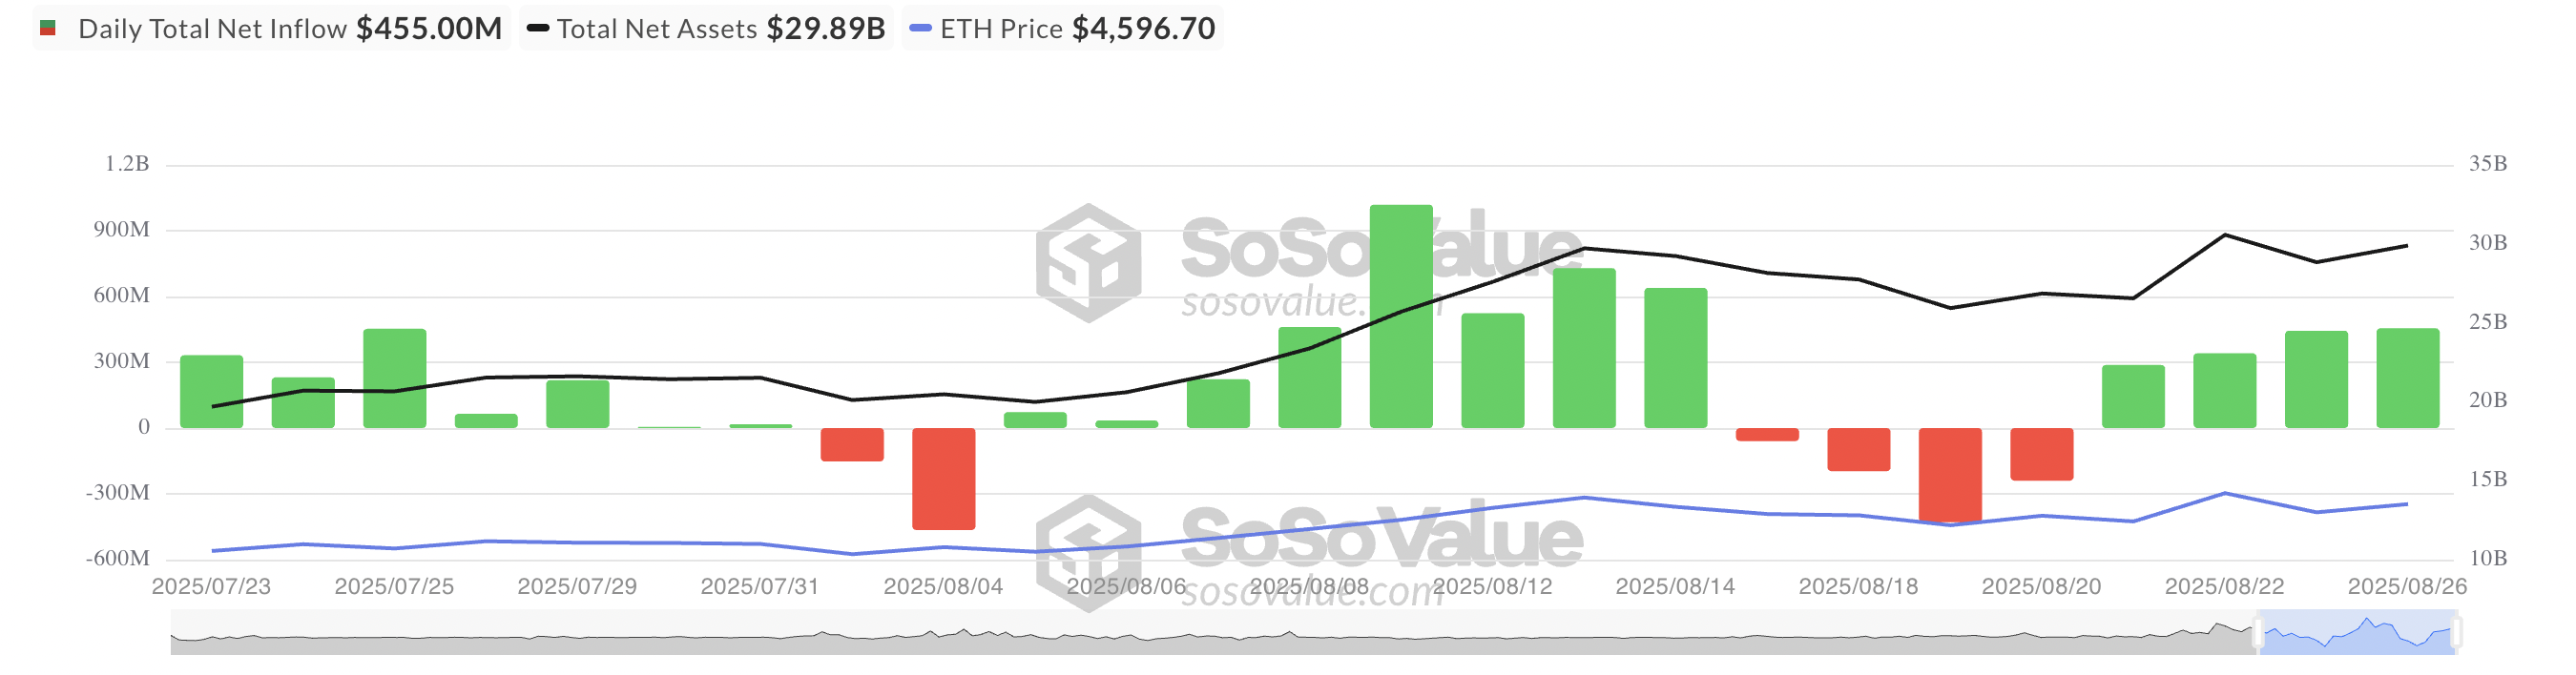
According to SosoValue, ETH ETFs have drawn in over $1.80 billion in inflows since August 21. It has outpaced BTC’s $388.45 million, reflecting a sharp shift in institutional interest, as capital flows increasingly tilt toward ETH over BTC.
For token TA and market updates: Want more token insights like this? Sign up for Editor Harsh Notariya’s Daily Crypto Newsletter .
 Total Ethereum Spot ETF Net Inflow. Source:
Coinglass
Total Ethereum Spot ETF Net Inflow. Source:
Coinglass
Ethereum’s daily ETF inflows have stayed consistently strong across the week, peaking at $455 million on August 26. By contrast, Bitcoin ETFs have struggled to maintain momentum, weighed down by net outflows, including nearly $200 million leaving on August 21.
This inflow advantage has fueled ETH’s stronger price performance against BTC, pushing its value up 7% in the past week, while BTC notes a 0.32% price fall during that period.
Bullish Bets on ETH Rise as Traders Position for Breakout
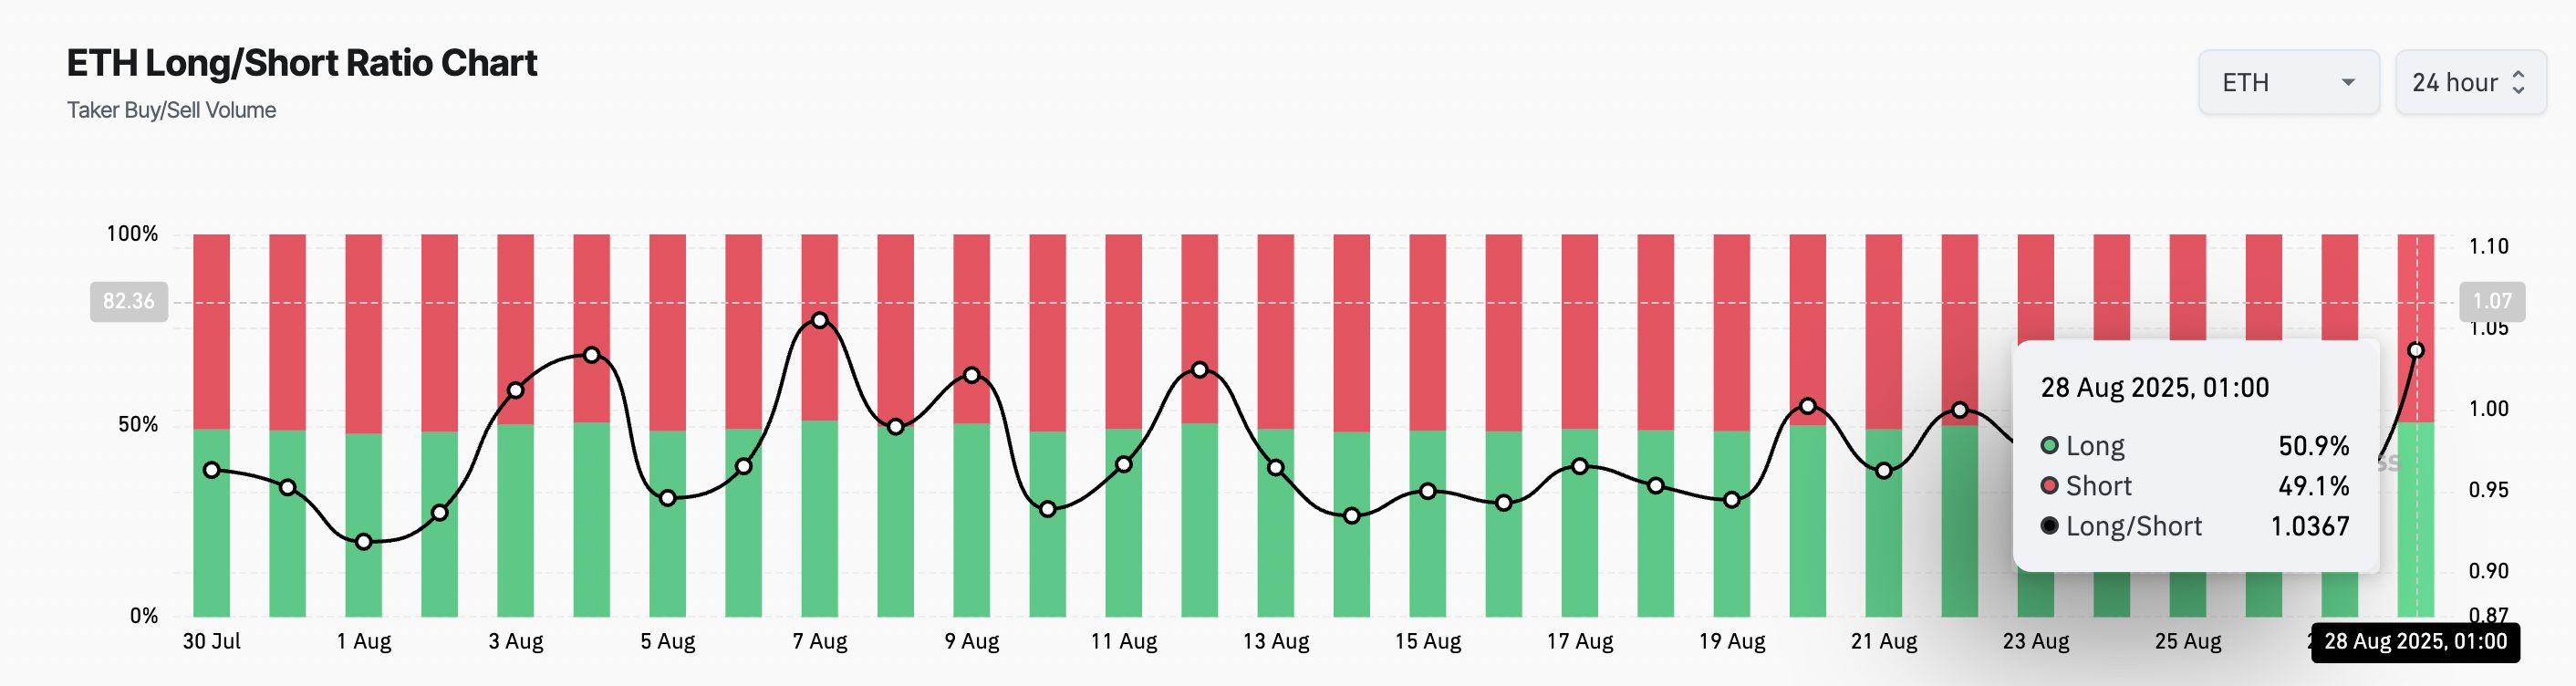
ETH’s long/short ratio remains above 1, showing that traders are backing the ETF-driven momentum with bullish positioning in derivatives markets.
According to CoinGlass, the ratio currently sits at 1.03, showing that more traders take long positions than short ones.
 ETH Long/Short Ratio. Source:
Coinglass
ETH Long/Short Ratio. Source:
Coinglass
The long/short ratio tracks the balance between traders betting on price increases (longs) versus those betting on declines (shorts).
When the ratio is above 1, it indicates that long positions dominate, signaling bullish sentiment. Conversely, a ratio below 1 suggests that short positions are heavier, pointing to bearish expectations.
For ETH, the climbing ratio suggests that many traders hope for an upside breakout soon.
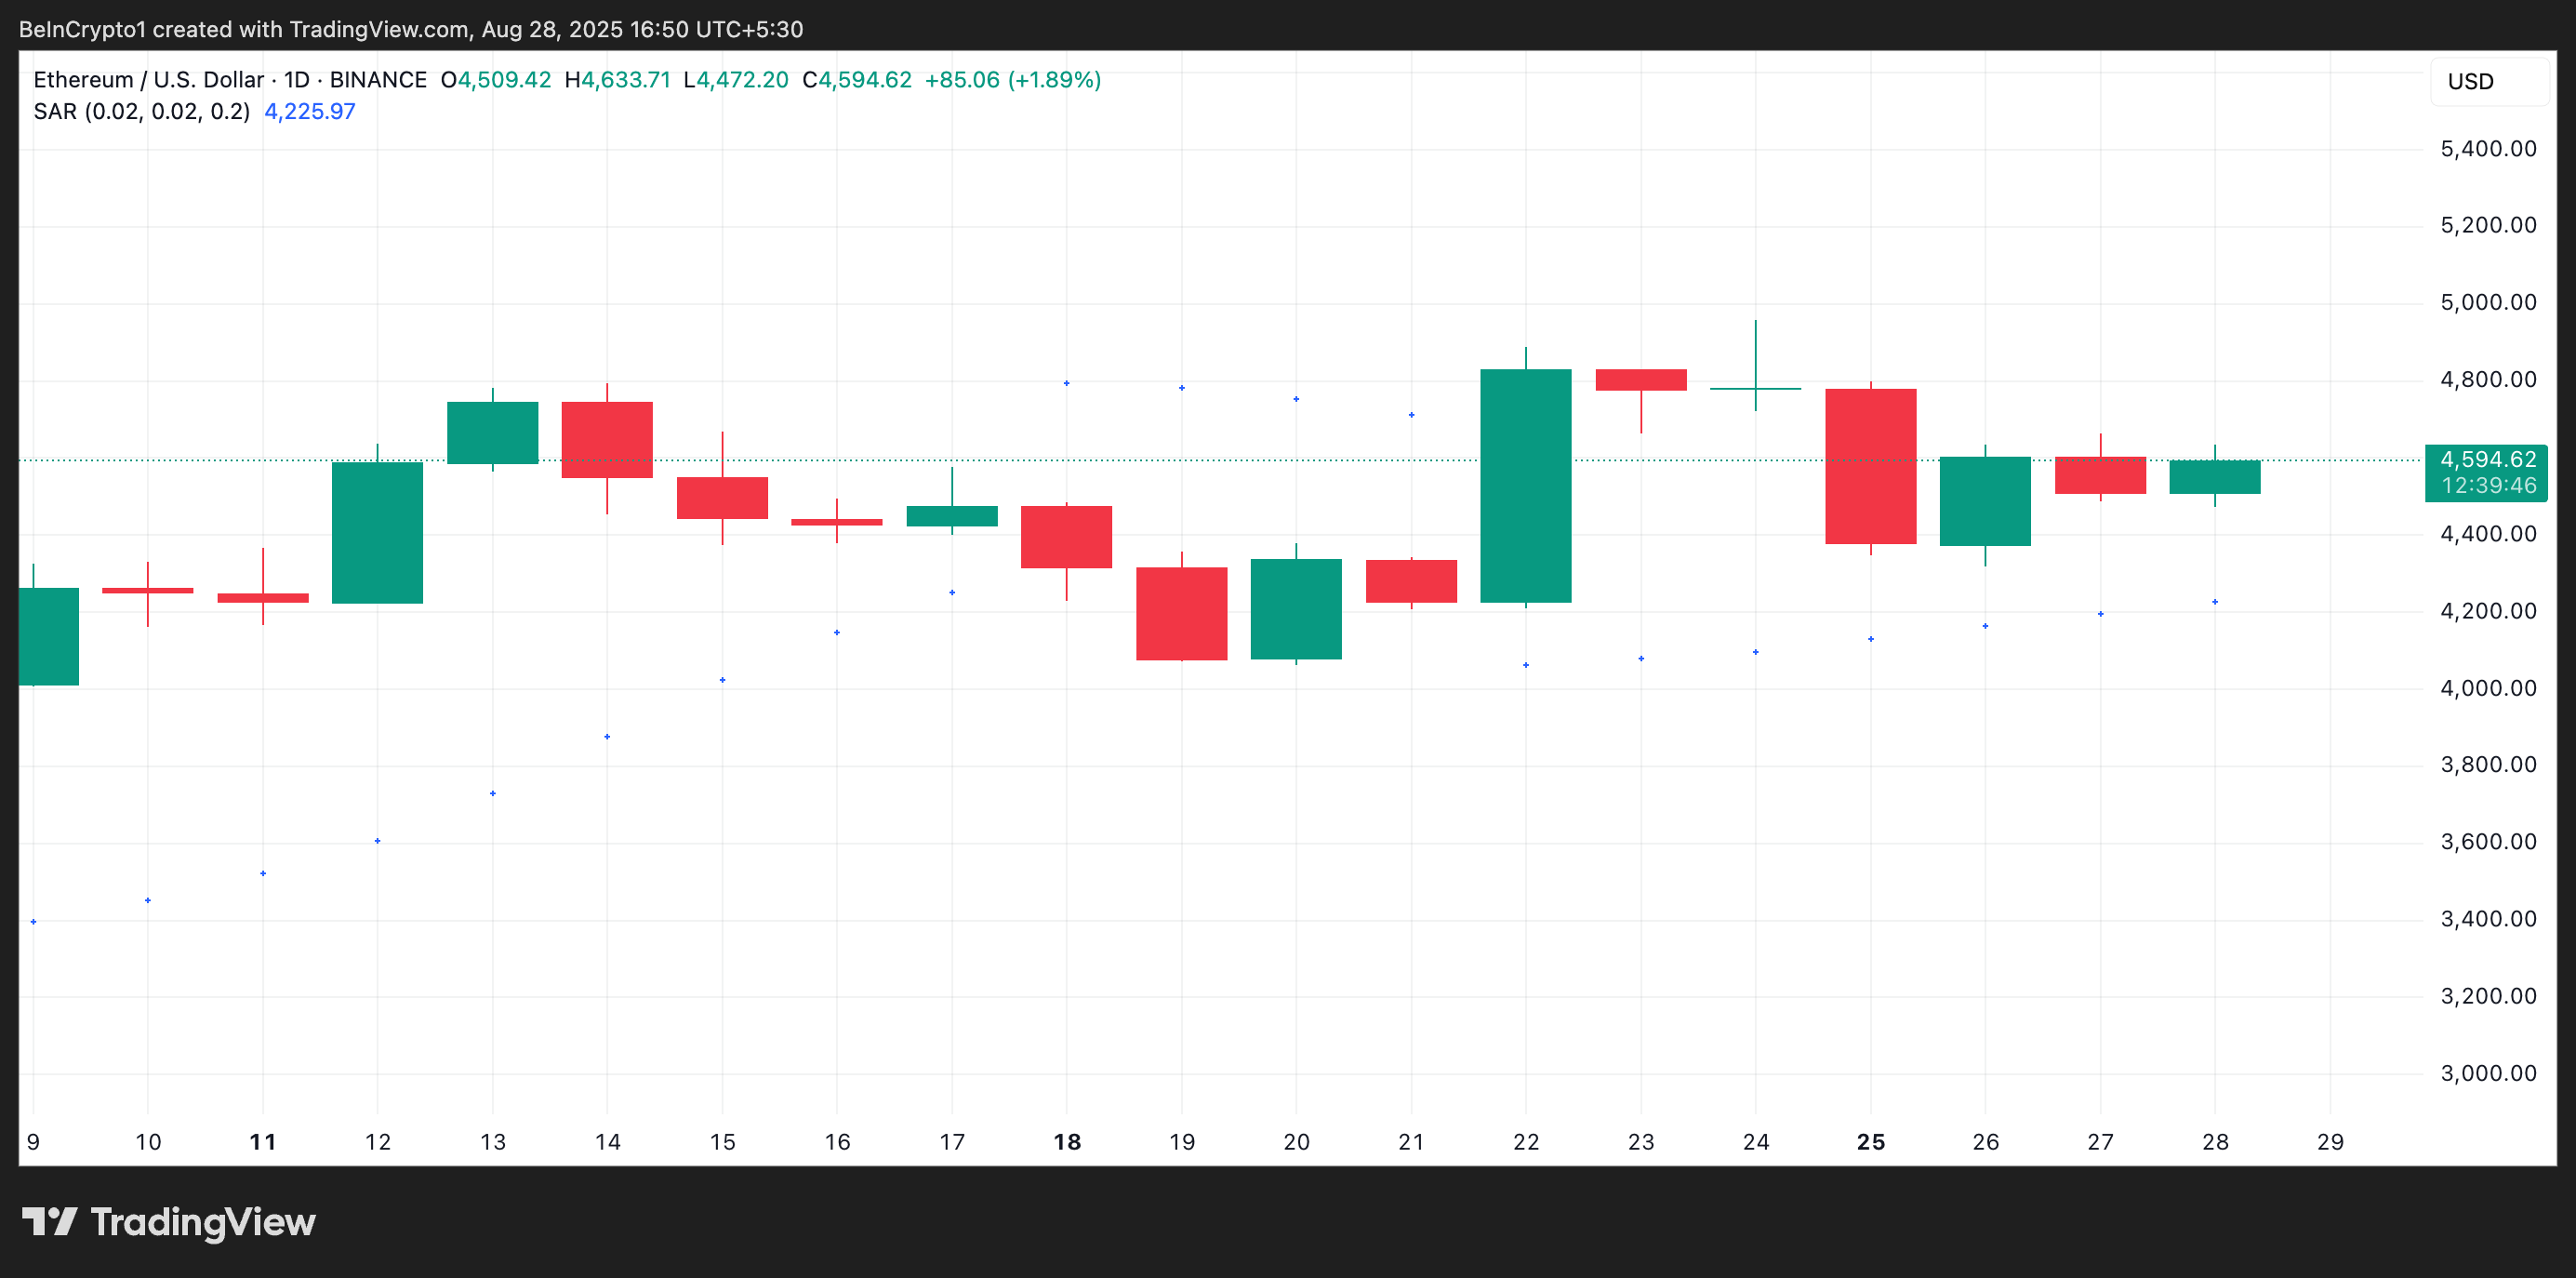
Moreover, readings from the ETH/USD one-day chart confirm this bullish outlook. At press time, the dots that comprise the coin’s Parabolic Stop and Reverse (SAR) indicator rest under ETH’s price, offering dynamic support at $4.225.
 Ethereum Parabolic SAR. Source:
TradingView
Ethereum Parabolic SAR. Source:
TradingView
An asset’s Parabolic SAR indicator identifies potential trend direction and reversals. When its dots are placed under an asset’s price, the market is in an uptrend. It indicates that the asset is witnessing bullish momentum, and its price could continue to rally if buying persists.
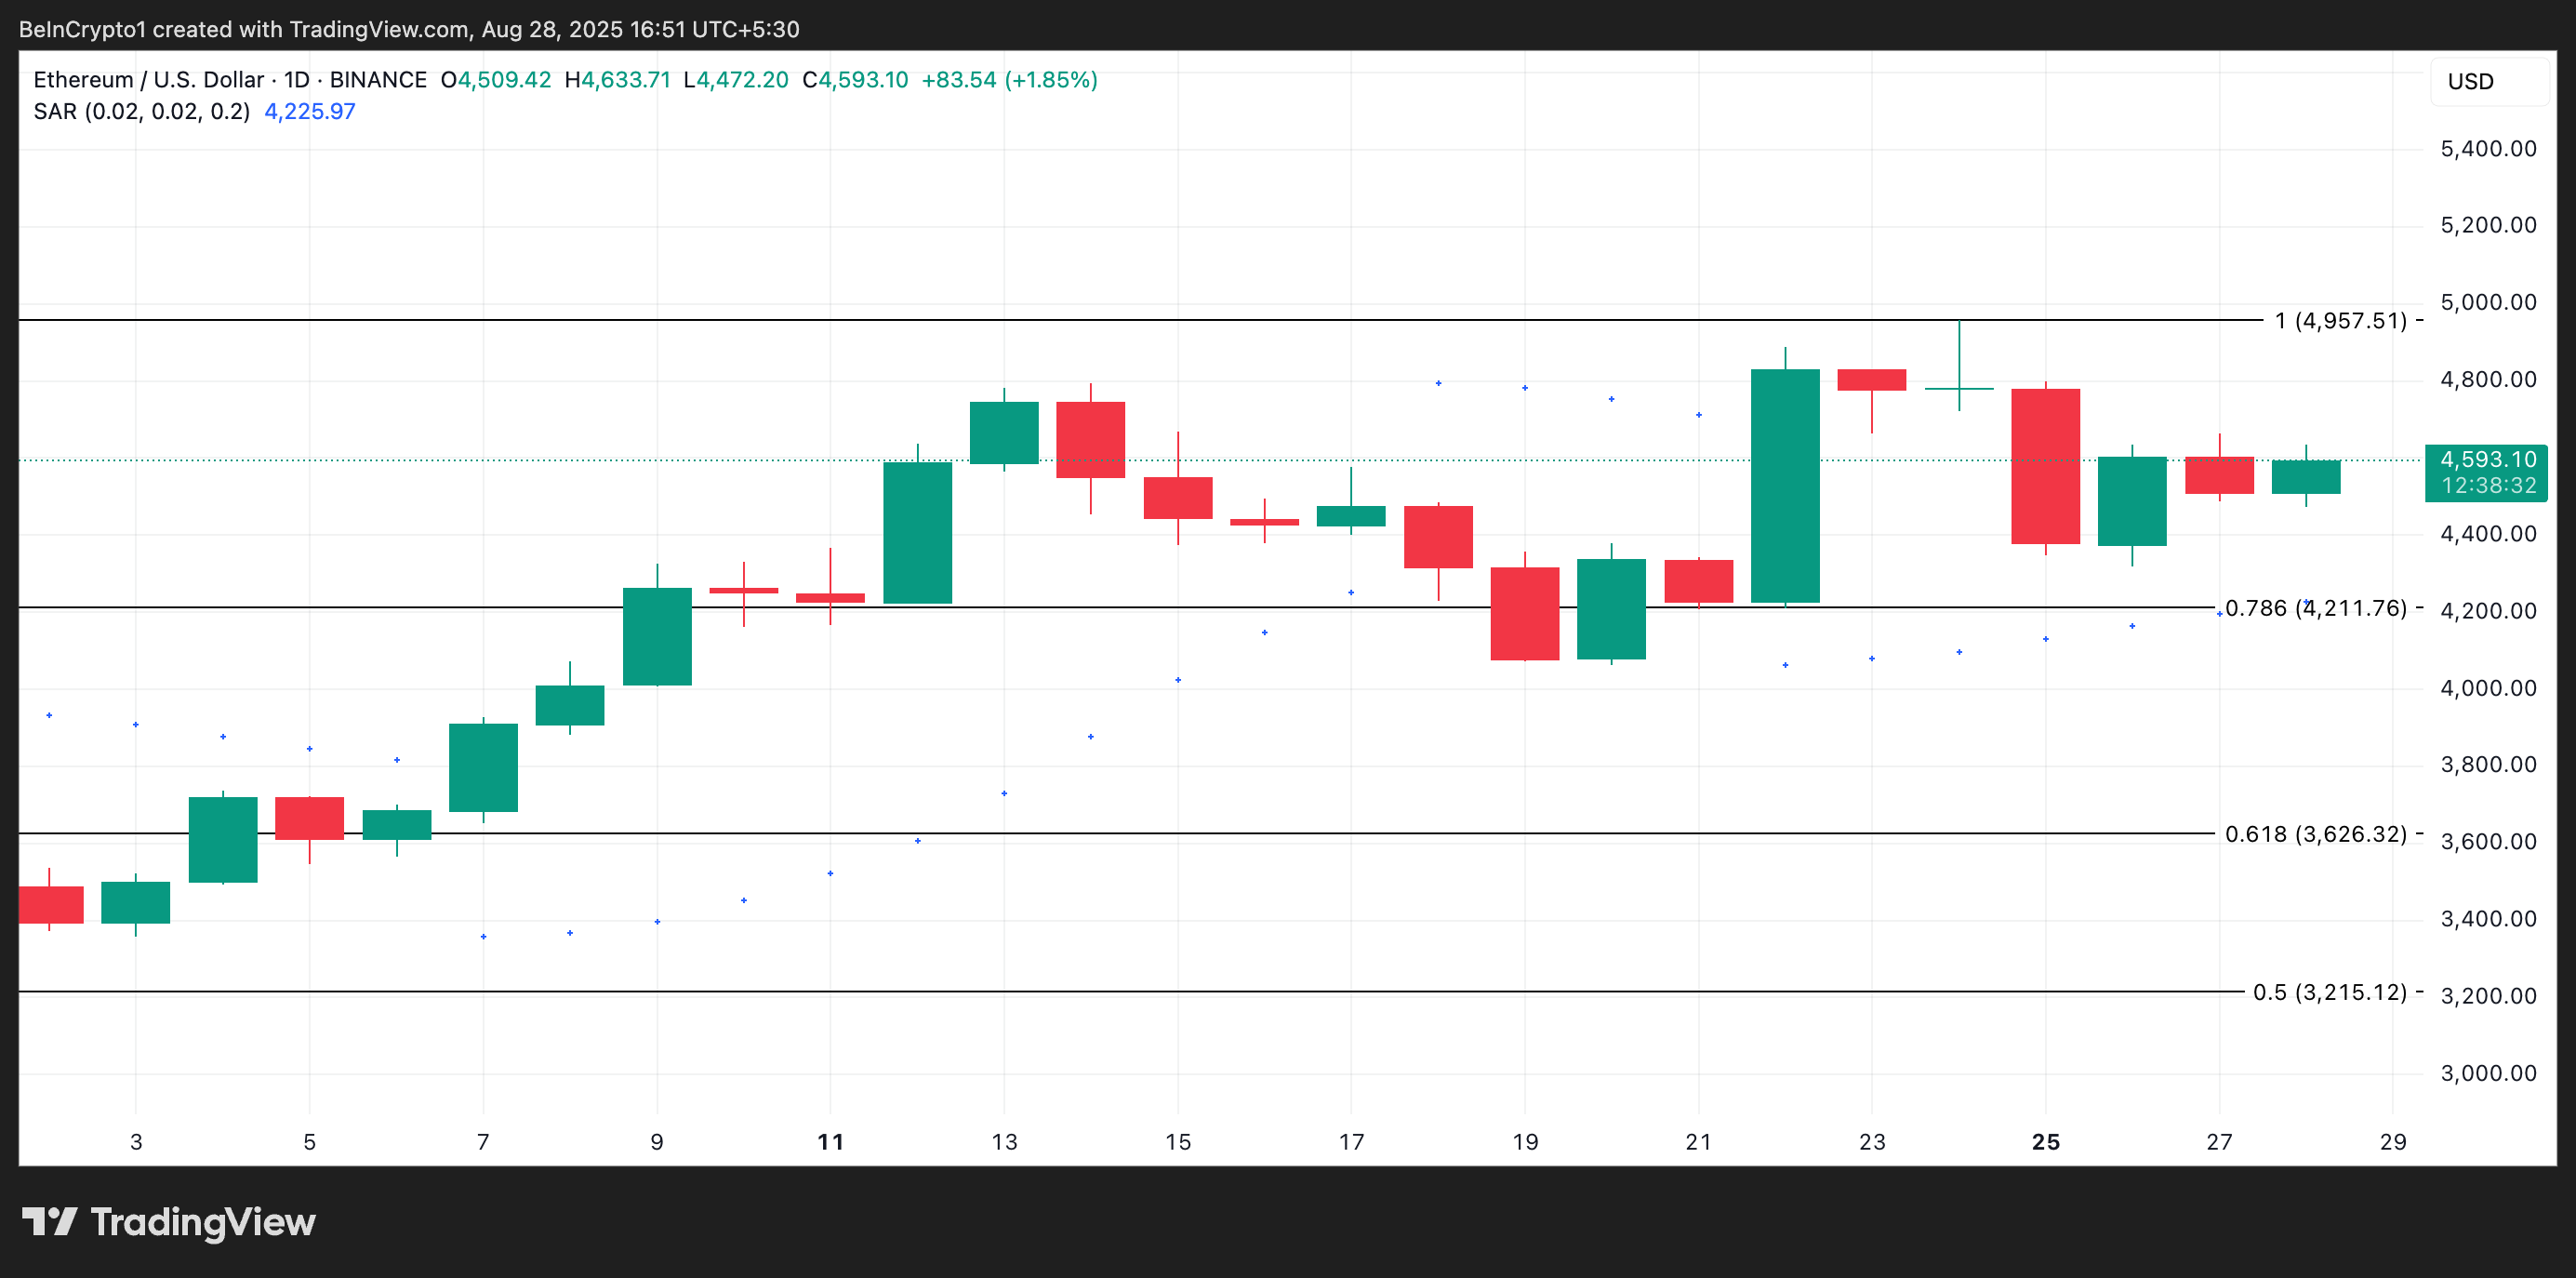
If inflows into ETH ETFs persist and bullish sentiment strengthens, Ethereum’s price could climb to $4,957.
 Ethereum Price Analysis. Source:
TradingView
Ethereum Price Analysis. Source:
TradingView
On the other hand, if inflows stall and buy-side pressure weakens, the coin’s price could decline toward $4,221.
Disclaimer: The content of this article solely reflects the author's opinion and does not represent the platform in any capacity. This article is not intended to serve as a reference for making investment decisions.
You may also like
Apple (AAPL.US) launches wall-mounted hub HomeView to enter the smart home market; analysts: may generate new income for the services segment
Apple launches a wall-mounted hub to enter the smart home market. Analysts say it may bring new revenue to the services segment, and a paid Siri AI is on the horizon.
U.S. IPO Preview|Primagrove: Soaring Performance with a 17-Fold Increase, but the $17,000 Cash Pool Raises Concerns
From software outsourcing to integrated software and hardware.
60% of stocks have fallen into a bear market, the seven tech giants are holding up the S&P alone! BTIG: US stocks may be just a "gentle push" away from collapsing
The S&P 500 is just one step away from its all-time high, but under the surface, turbulence is brewing: 60% of its components have already entered a technical bear market, and only 30% have outperformed the index, the lowest since 1991. All of this is being supported solely by the seven major tech giants—which is, in fact, the biggest risk. With crowded positions and the semiconductor sector mirroring the path of the 2000 bubble burst, an accelerated decline could be triggered during the upcoming earnings season at the end of the month. When the market is standing on just one final leg, it doesn't take much force to topple it.

Earnings Season Underlying Currents: ASML (ASML.US) Leads with $34.8 Billion Market Value Fluctuation
Before Wednesday’s market open, seven major companies are expected to report earnings, with anticipated volatility. ASML tops the list with a potential volatility of $34.8 billion, followed by Bank of America, Morgan Stanley, and others. The options market has already priced in the risks in advance.

Crypto prices
More


