Date: Tue, Sept 02, 2025 | 12:04 PM GMT
The cryptocurrency market remains volatile as Bitcoin (BTC) consolidates near $110,000, while Ethereum (ETH) hovers around $4,384 after retreating from its recent high of $4,953. Amid this broader choppiness, several altcoins are delivering mixed performances, with layer-1 token Sei (SEI) beginning to flash early signs of strength.
SEI is trading back in the green today, and more importantly, its chart is now displaying a harmonic setup that suggests the potential for a significant bounce back.
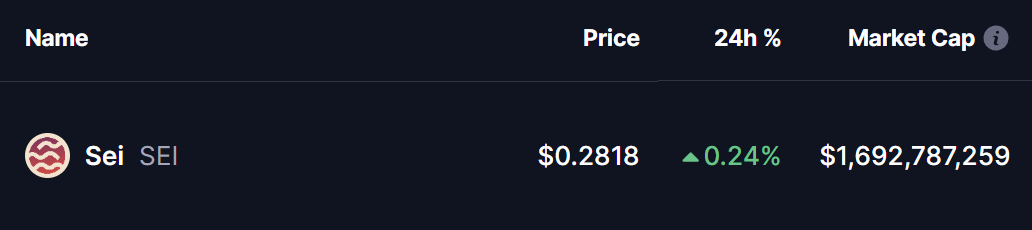 Source: Coinmarketcap
Harmonic Pattern Hints at Potential Upside
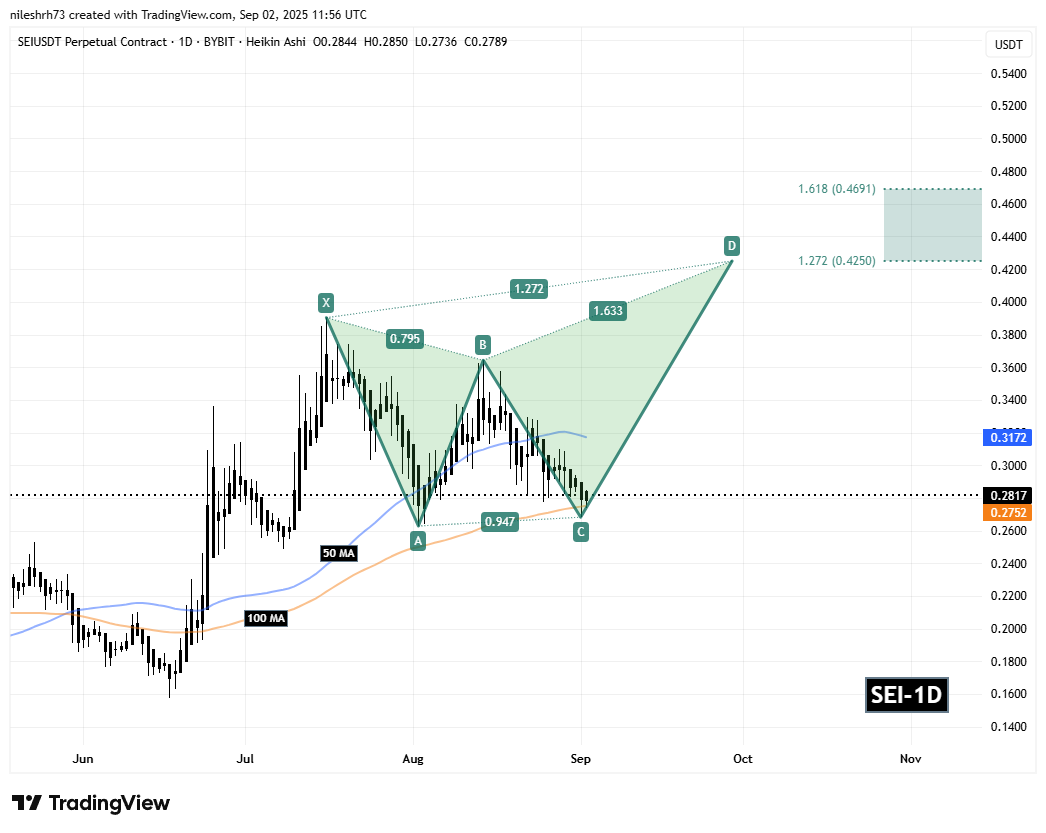
On the daily chart, SEI is developing a Bearish Butterfly harmonic pattern. Despite the bearish name, the CD leg of this pattern often extends higher before testing the Potential Reversal Zone (PRZ).
The structure began at point X ($0.3903), retraced down to A, then rallied to B, before dipping to C near $0.2682. Since then, SEI has rebounded slightly and is currently trading around $0.2817, still in the early stage of confirming its bullish continuation.
 Sei (SEI) Daily Chart/Coinsprobe (Source: Tradingview)
A key technical level to watch is the 50-day moving average ($0.3172). A decisive break and close above this line could flip it into strong support, setting the stage for a further rally.
What’s Next for SEI?
If bulls defend the 100-day MA ($0.2752) or the C-point support ($0.2682) and push higher, the CD leg could drive SEI toward the PRZ between $0.4250 (1.272 Fibonacci extension) and $0.4691 (1.618 extension). These levels are historically where the Butterfly pattern tends to complete, making them critical upside targets.
On the flip side, if SEI fails to hold $0.2682, the pattern setup would weaken, and traders may need to reassess whether a new C-point is forming.
For now, both moving averages and harmonic signals suggest SEI could be preparing for a potential bounce — but confirmation hinges on the 50-day MA breakout.