Bitget App
Trade smarter
Buy cryptoMarketsTradeFuturesStocksEarnInstitutionAI & More
TROLL Price Climbs 30.2% in Weekly Rally as Market Cap Holds Near $198.9 Million

TROLL Price Climbs 30.2% in Weekly Rally as Market Cap Holds Near $198.9 Million

CryptonewslandCryptonewsland2025/09/05 20:15
By:by Vee Peninah
  • TROLL gained 30.2% in the past week, reaching $0.2181 with market capitalization near $198.9 million.
  • Support remains at $0.1854, while resistance near $0.2221 continues to restrict upward momentum.
  • Market cap peaked at $276.5 million before retracing, with liquidity steady at $6.2 million.

TROLL (TROLL) has seen a significant price growth in the past seven days and the token is currently trading at $0.2181 . Statistics indicate a 30.2 % increase over seven days, which illustrates a week of good performance. 

The current market capitalization is close to 198.9 million and liquidity is reported as 6.2M. The 24 hour trading range has been $0.1854 to $0.2221. Technical levels observed indicate that the market has support at level of $0.1854 and resistance at level of $0.2221 which are of critical concern to the market participants.

Weekly Performance and Market Standing

During the past week, TROLL’s market behavior has reflected consistent advances that lifted its valuation. The token’s 30.2% rise has moved its trading value higher, supported by increasing activity. Market data indicates TROLL also trades against Bitcoin at 0.051933 BTC, reflecting a 9.5% increase on this pair.

This growth has followed earlier market fluctuations where the token established both support and resistance levels with notable precision. The 24-hour chart further reflects this tight range, with price movement restricted between $0.1854 and $0.2221.

they say $743M is a stretch for $TROLL but they forgot who called this at $22M. 😳

similar doubters when we said TROLL is gonna 10x just over a month ago.

just look at those fibs and how clean $TROLL is respecting them whether it's a target or a support level. https://t.co/VykADyKPTI pic.twitter.com/9HKoRz4LCN

— 💎GEM INSIDER💎 (@gem_insider) September 5, 2025

Technical Levels and Chart Observations

Charts show TROLL’s price reacting to previously identified Fibonacci levels, which continue to define targets and support points. Recent sessions have demonstrated how price has aligned with both levels of retracement and extensions. This alignment has reinforced observed support zones and capped moves at resistance points.

One significant area remains the $0.1854 level, which has acted as support during declines. Conversely, $0.2221 has limited upside attempts and stands as immediate resistance. The daily chart confirms repeated interaction with these zones, illustrating their current significance for near-term action.

Market Capitalization and Broader Context

Market capitalization for TROLL is now recorded at approximately $198.9 million. Notably, this value is measured against earlier levels when capitalization stood near $22 million. This change underscores the extent of growth over recent months.
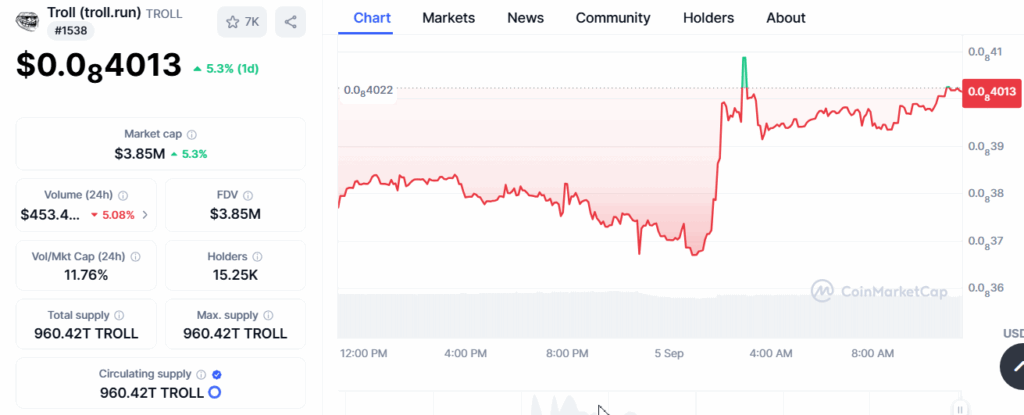
TROLL Price Climbs 30.2% in Weekly Rally as Market Cap Holds Near $198.9 Million image 0 TROLL Price Climbs 30.2% in Weekly Rally as Market Cap Holds Near $198.9 Million image 1

Source; CoinmarketCap

Current fully diluted valuation is reported at $199.5 million. Within the same period, liquidity has remained steady at $6.2 million, supporting daily activity. Transaction volume also reflects active participation, contributing to price movements observed throughout August and early September.

TROLL’s highest market capitalization during this rally reached approximately $276.5 million before retracing to current values. However, the token has maintained stability within a defined zone, with charts showing repeated engagement at Fibonacci levels that continue to guide trading activity.
0
0

Disclaimer: The content of this article solely reflects the author's opinion and does not represent the platform in any capacity. This article is not intended to serve as a reference for making investment decisions.

Understand the market, then trade.
Bitget offers one-stop trading for cryptocurrencies, stocks, and gold.
Trade now!

You may also like

$2.3 trillion “vanished into thin air”! The last time US chip stocks fell this badly was in 2001, Nvidia has already “lost an Amazon’s worth”.

This week, the Philadelphia Semiconductor Index dropped by over 10%, wiping out approximately $2.3 trillion in market capitalization from the chip sector, marking its worst single-week performance since 2001. Nvidia’s stock price has fallen for seven consecutive weeks, shrinking its market value by about $2.7 trillion since its October peak. Tightened financing support from Nvidia and the Anthropic IPO siphoning off liquidity, combined with continued hawkish signals from the Federal Reserve, have added further pressure. AI-related trades have faced concentrated sell-offs, and market concerns about future growth prospects are intensifying.

华尔街见闻•2026/11/21 02:36
$2.3 trillion “vanished into thin air”! The last time US chip stocks fell this badly was in 2001, Nvidia has already “lost an Amazon’s worth”.

Nasdaq evaporated over $4 trillion in a week! After the global stock market's "Black Friday," the market begins to anticipate an AI industry chain rebound after excessive declines.

The S&P 500 Index plunged by 3.70% on Friday to 6,910.39 points, falling for the seventh consecutive trading day. Alongside the Dow Jones Industrial Average, which dropped 1.93%, both indices pulled back more than 10% from their historic closing highs, confirming entry into a technical correction. The Nasdaq Composite Index fell 5.28%, erasing its gains for the year. The Nasdaq 100 Index dropped 5.61%, falling about 19.84% from its historic closing high on October 6. At one point during the session, the decline exceeded 20%, entering what is referred to as a "technical bear market area."

智通财经•2026/11/21 02:01

VIX surges to highest level since the tariff dispute in April last year; Goldman Sachs Fear Index approaches maximum; US stocks may face another $80 billion sell-off next week

As the U.S. stock market faced a sharp sell-off on Friday, two major Wall Street market risk indicators issued warnings simultaneously.

智通财经•2026/11/20 23:42

Nvidia (NVDA.US) plunges 46% over seven weeks, marking the longest losing streak since the 2008 financial crisis, with its market capitalization evaporating by $2.6 trillion.

Nvidia is experiencing its longest consecutive weekly decline since the 2008 global financial crisis.

智通财经•2026/11/20 23:36