

Stellar (XLM) price rose over 4% after a golden cross formed, signaling potential bullish momentum, but it remains below the key $0.40 resistance. Volume jumped ~85% to $333.21M, and a decisive break above $0.405 could target $0.47–$0.50 in the near term.
-
Golden cross formed: short-term MA crossed above long-term MA, indicating bullish momentum.
-
Volume spiked ~84.95% to $333.21 million, showing increased buying interest.
-
XLM up ~5.4% intraday but still below $0.40 resistance; 30-day decline remains ~15%.
Stellar (XLM) price rises after golden cross; volume surges ~85%. Read our concise market update and next resistance levels now. (Stellar (XLM) price update)
What is Stellar (XLM) price doing after the golden cross?
Stellar (XLM) price rose from $0.3574 to $0.3831 after a golden cross formed, recording a 5.4% uptick intraday. The pattern signals bullish momentum, but XLM remains below the critical $0.40 resistance and needs further buying pressure to confirm a sustained breakout.
How strong is the recent buying activity and volume spike?
Volume surged by 84.95% to $333.21 million, indicating heavy trading activity. High volume alongside a golden cross is bullish, but so far this has produced a modest price move rather than a decisive breakout above $0.40.
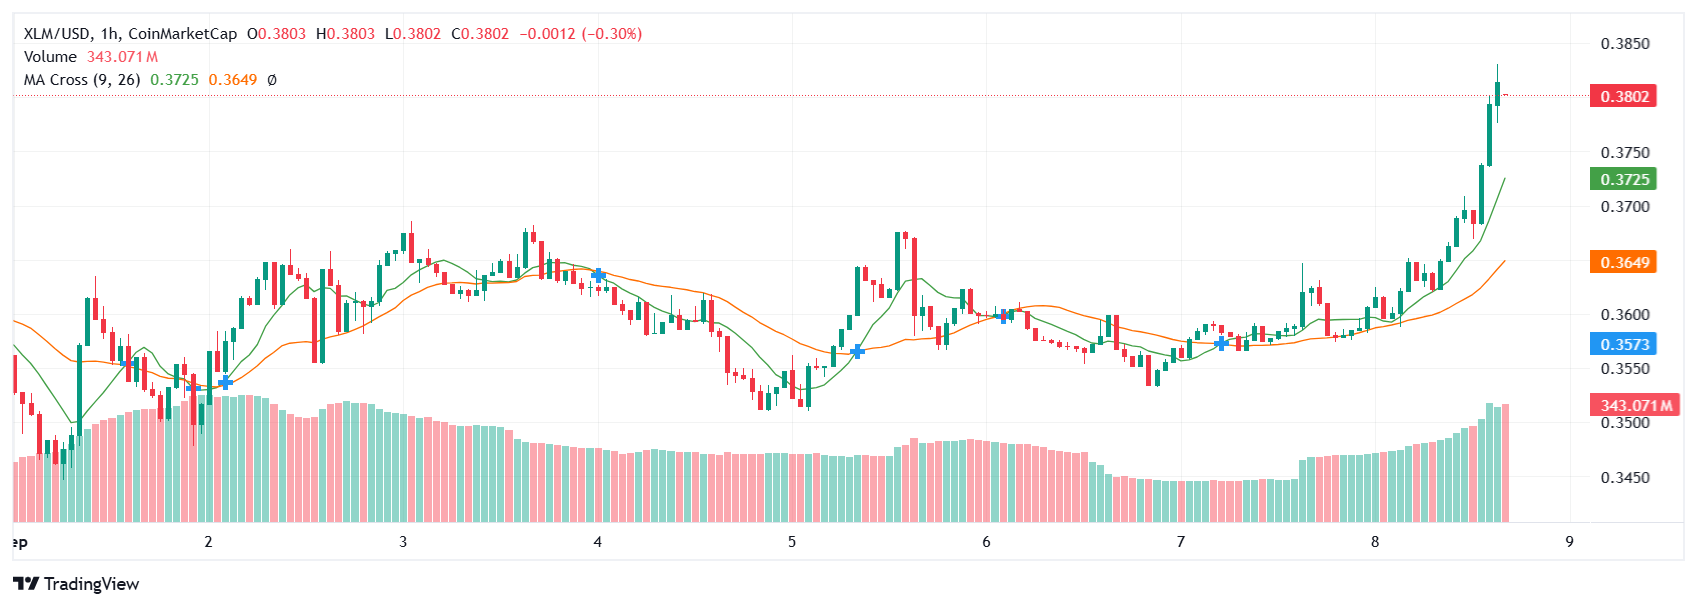
XLM Price Chart | Source: TradingView
Why has Stellar not flipped $0.40 despite the golden cross?
Stellar has fallen ~15% in the last 30 days from $0.452 to current levels, leaving overhead resistance and trader caution. The golden cross improves the probabilistic outlook but does not guarantee an immediate breakout; market participants are waiting for confirmation above $0.405.
When could XLM target $0.47–$0.50?
If XLM clears and holds above $0.405, momentum may push it to a near-term target of $0.47. Historical patterns suggest a re-test of $0.50 is possible later in September, contingent on sustained volume and easing volatility.
How does Stellar’s yearly performance compare to Bitcoin and Ethereum?
Year-to-date figures show Stellar outperforming major peers. XLM posted a yearly surge of 288%, compared to ~88% for Bitcoin and ~73% for Ethereum. These comparative gains highlight XLM’s relative strength this cycle.
| Stellar (XLM) | 288% |
| Bitcoin (BTC) | 88% |
| Ethereum (ETH) | 73% |
How to interpret the golden cross for traders?
The golden cross occurs when a short-term moving average crosses above a long-term moving average and is commonly read as a bullish sign. Traders should confirm with volume, volatility, and key resistance breaks before increasing position size.
Frequently Asked Questions
Will the golden cross push XLM above $0.40 soon?
It could, but not immediately guaranteed. The golden cross raises the probability of a bullish move; a sustained break above $0.405 with follow-through volume is the clearest path to $0.47.
How should I use volume spikes in my XLM strategy?
Use volume spikes to confirm momentum. A volume increase near 85% (as seen) supports bullish cases, but pair it with price action above resistance to avoid false breakouts.
Key Takeaways
- Golden cross observed: Signals bullish momentum but needs confirmation.
- Volume surge: ~84.95% increase to $333.21M reinforces buying interest.
- Watch $0.405: A clean breakout and retest here could target $0.47–$0.50.
Conclusion
Stellar (XLM) price shows early signs of a bullish reversal after a golden cross and a significant volume spike. However, price action must decisively clear and hold above $0.405 to target higher levels. Monitor on-chain metrics, TradingView charts, and market-wide volatility for confirmation. Published by COINOTAG on 2025-09-08. Updated 2025-09-08.


