

XRP price is consolidating around $2.82, with buyers eyeing a $3.00 breakout as RSI at 58, a near-term MACD crossover, and increased whale inflows support a reversal setup. A sustained close above $2.90 would confirm momentum toward $3.00–$3.20 targets.
-
XRP consolidates at $2.82; $3.00 is the immediate upside target.
-
RSI at 58 and a tightening MACD histogram point to neutral-to-bullish momentum.
-
On-chain flows show 1.7M tokens bought last month and 340M XRP whale inflows.
XRP price consolidates at $2.82 with buyers targeting $3.00; monitor RSI, MACD, and whale flows for breakout confirmation. Read more now.
XRP trades near $2.82, consolidating with buyers eyeing $3.00 as RSI, MACD, whale inflows, and ETF decisions shape momentum.
XRP is trading around $2.82, showing signs of stabilizing after a prolonged downtrend. The chart indicates a possible reversal setup, with buyers closely watching the $3.00 zone as the next target. A clean breakout from the current consolidation could trigger bullish momentum and set the stage for renewed growth.
What is driving XRP consolidation near $2.82?
XRP price is consolidating near $2.82 as technical indicators and on-chain accumulation align. RSI around 58 signals neutral-to-bullish momentum while the MACD histogram is narrowing toward a bullish crossover, and sizable whale inflows and weekly accumulation suggest increasing demand ahead of potential ETF-related catalysts.
How close is XRP to breaking $3.00?
Price action shows a consolidation band between $2.82 and $2.89. A decisive close above $2.90 would validate short-term momentum and increase the probability of reaching $3.00. Traders should watch intraday volume and a confirmed MACD crossover for conviction.
Why are RSI and MACD important for XRP traders?
RSI and MACD provide early momentum and trend-change signals. RSI at 58 suggests room to run before overbought levels, while a MACD histogram shrinking toward zero often precedes a bullish crossover, which many traders use as a buy signal when confirmed by volume and price action.
When do whale inflows matter for long-term outlook?
Whale inflows matter when sustained over several weeks, indicating accumulation. The recent report of 340 million XRP in whale inflows and 1.7 million tokens purchased in a month suggests institutional or large-holder interest, which can support higher price floors if distribution remains limited.
$XRP is trading around $2.82 showing signs of stabilizing after a prolonged downtrend.
Chart indicates a possible reversal setup, with buyers aiming for the $3.00 zone as the next target.
A clean breakout from current consolidation could trigger bullish momentum. pic.twitter.com/NyZXecsvPs
— BitGuru 🔶 (@bitgu_ru) September 7, 2025
Resistance remained near $3.10, where repeated attempts to advance had failed. Current consolidation between $2.82 and $2.89 suggests market stabilization. According to an analysis prepared by BitGuru, buyers are aiming for the $3.00 area as the next technical target. A close above $2.90 would confirm momentum toward this level.
Indicators show conditions aligning for a potential reversal. The RSI stood at 58, signaling neutral-to-bullish momentum. Meanwhile, the MACD histogram moved closer to a bullish crossover. Recent candles displayed small-bodied moves followed by aggressive closes, adding strength to the reversal outlook.
How is accumulation shaping the longer-term XRP outlook?
Accumulation metrics show rising investor activity. Observations by Dark Defender indicate a weekly resistance test at $3.00. Data notes 1.7 million tokens purchased in the past month and 340 million XRP whale inflows, reinforcing accumulation and the potential for higher targets if resistance levels are breached.
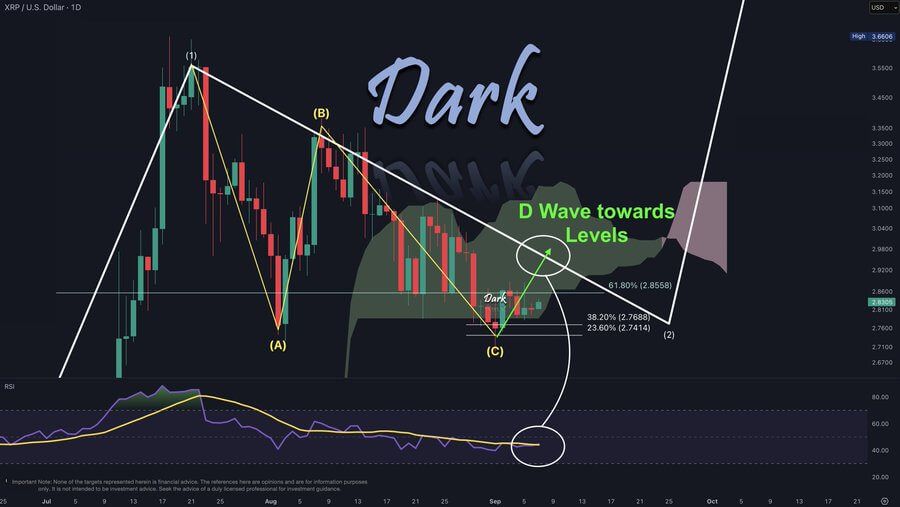 Source: DarkDefender(X)
The Network Value to Transactions ratio reached a two-month high, pointing to stronger network valuation relative to activity. Historically, similar patterns have preceded upward moves for XRP. A clean breakout above $2.89 may lead toward $2.95 and extend to $3.04 if confirmed by volume.
Support remains near $2.70, with stronger levels at $2.63 and $2.50. A move below these would shift sentiment. Longer-term projections suggest possible advances toward $4.00–$4.50 if resistance near $3.20 and $3.60 are cleared. Upcoming regulatory decisions on ETF approvals in October may add to momentum.
Frequently Asked Questions
What are the immediate price levels to watch for XRP?
Watch $2.90 for confirmation, $3.00 for the first major breakout target, and $3.20–$3.60 as secondary resistance zones. Support levels to monitor are $2.70, $2.63, and $2.50.
How should traders use on-chain data with technical signals?
Combine on-chain accumulation (whale inflows, purchase volumes) with technical confirmation (close above $2.90, MACD crossover, increasing volume) to reduce false breakouts and improve trade timing.
Key Takeaways
- Current State: XRP consolidates at $2.82 with buyers targeting $3.00.
- Technical Signals: RSI at 58 and a narrowing MACD histogram favor a potential reversal if volume supports a breakout.
- On-Chain Support: 1.7M tokens bought last month and 340M whale inflows indicate accumulation that may sustain higher price levels.
Conclusion
In summary, XRP price is stabilizing near $2.82 with technical and on-chain indicators aligning for a potential move toward $3.00. Traders should seek confirmation via a close above $2.90, rising volume, and a MACD crossover. COINOTAG will monitor ETF decisions and accumulation trends for further updates.


