
World’s ( WLD) Unworldly Price Rally Risks A Pullback, Here Is Why It Could Be A Healthy One

WLD price has rallied sharply, but signals now point to a likely pullback. Profit-taking and overheated RSI warn of cooling, yet strong dip buying and a possible golden cross hint that the correction could remain healthy instead of turning into a full reversal.
Worldcoin (WLD) price sits at $1.85, up 45% in the past 24 hours and over 110% this week. Three-month gains now stand at 50%, lifting yearly returns by 26% after a long stretch of negative performance.
Such rapid gains rarely come without a pause. The signs suggest a pullback is imminent, but other signals point to it being a healthy breather rather than a trend reversal.
Profit-Taking Puts Pressure on the Rally
One red flag comes from the percentage of supply in profit. Between September 7 and 8, the share of WLD in profit jumped from 62.3% to 79.3%. This means nearly 80% of holders are sitting on gains — a setup that usually invites profit-taking.
Exchange flows confirm this: retail and short-term wallets have sent tokens to exchanges, pushing exchange balances up by 2.23%. At $1.83 per token, that rise represents roughly $11 million in potential sell pressure.
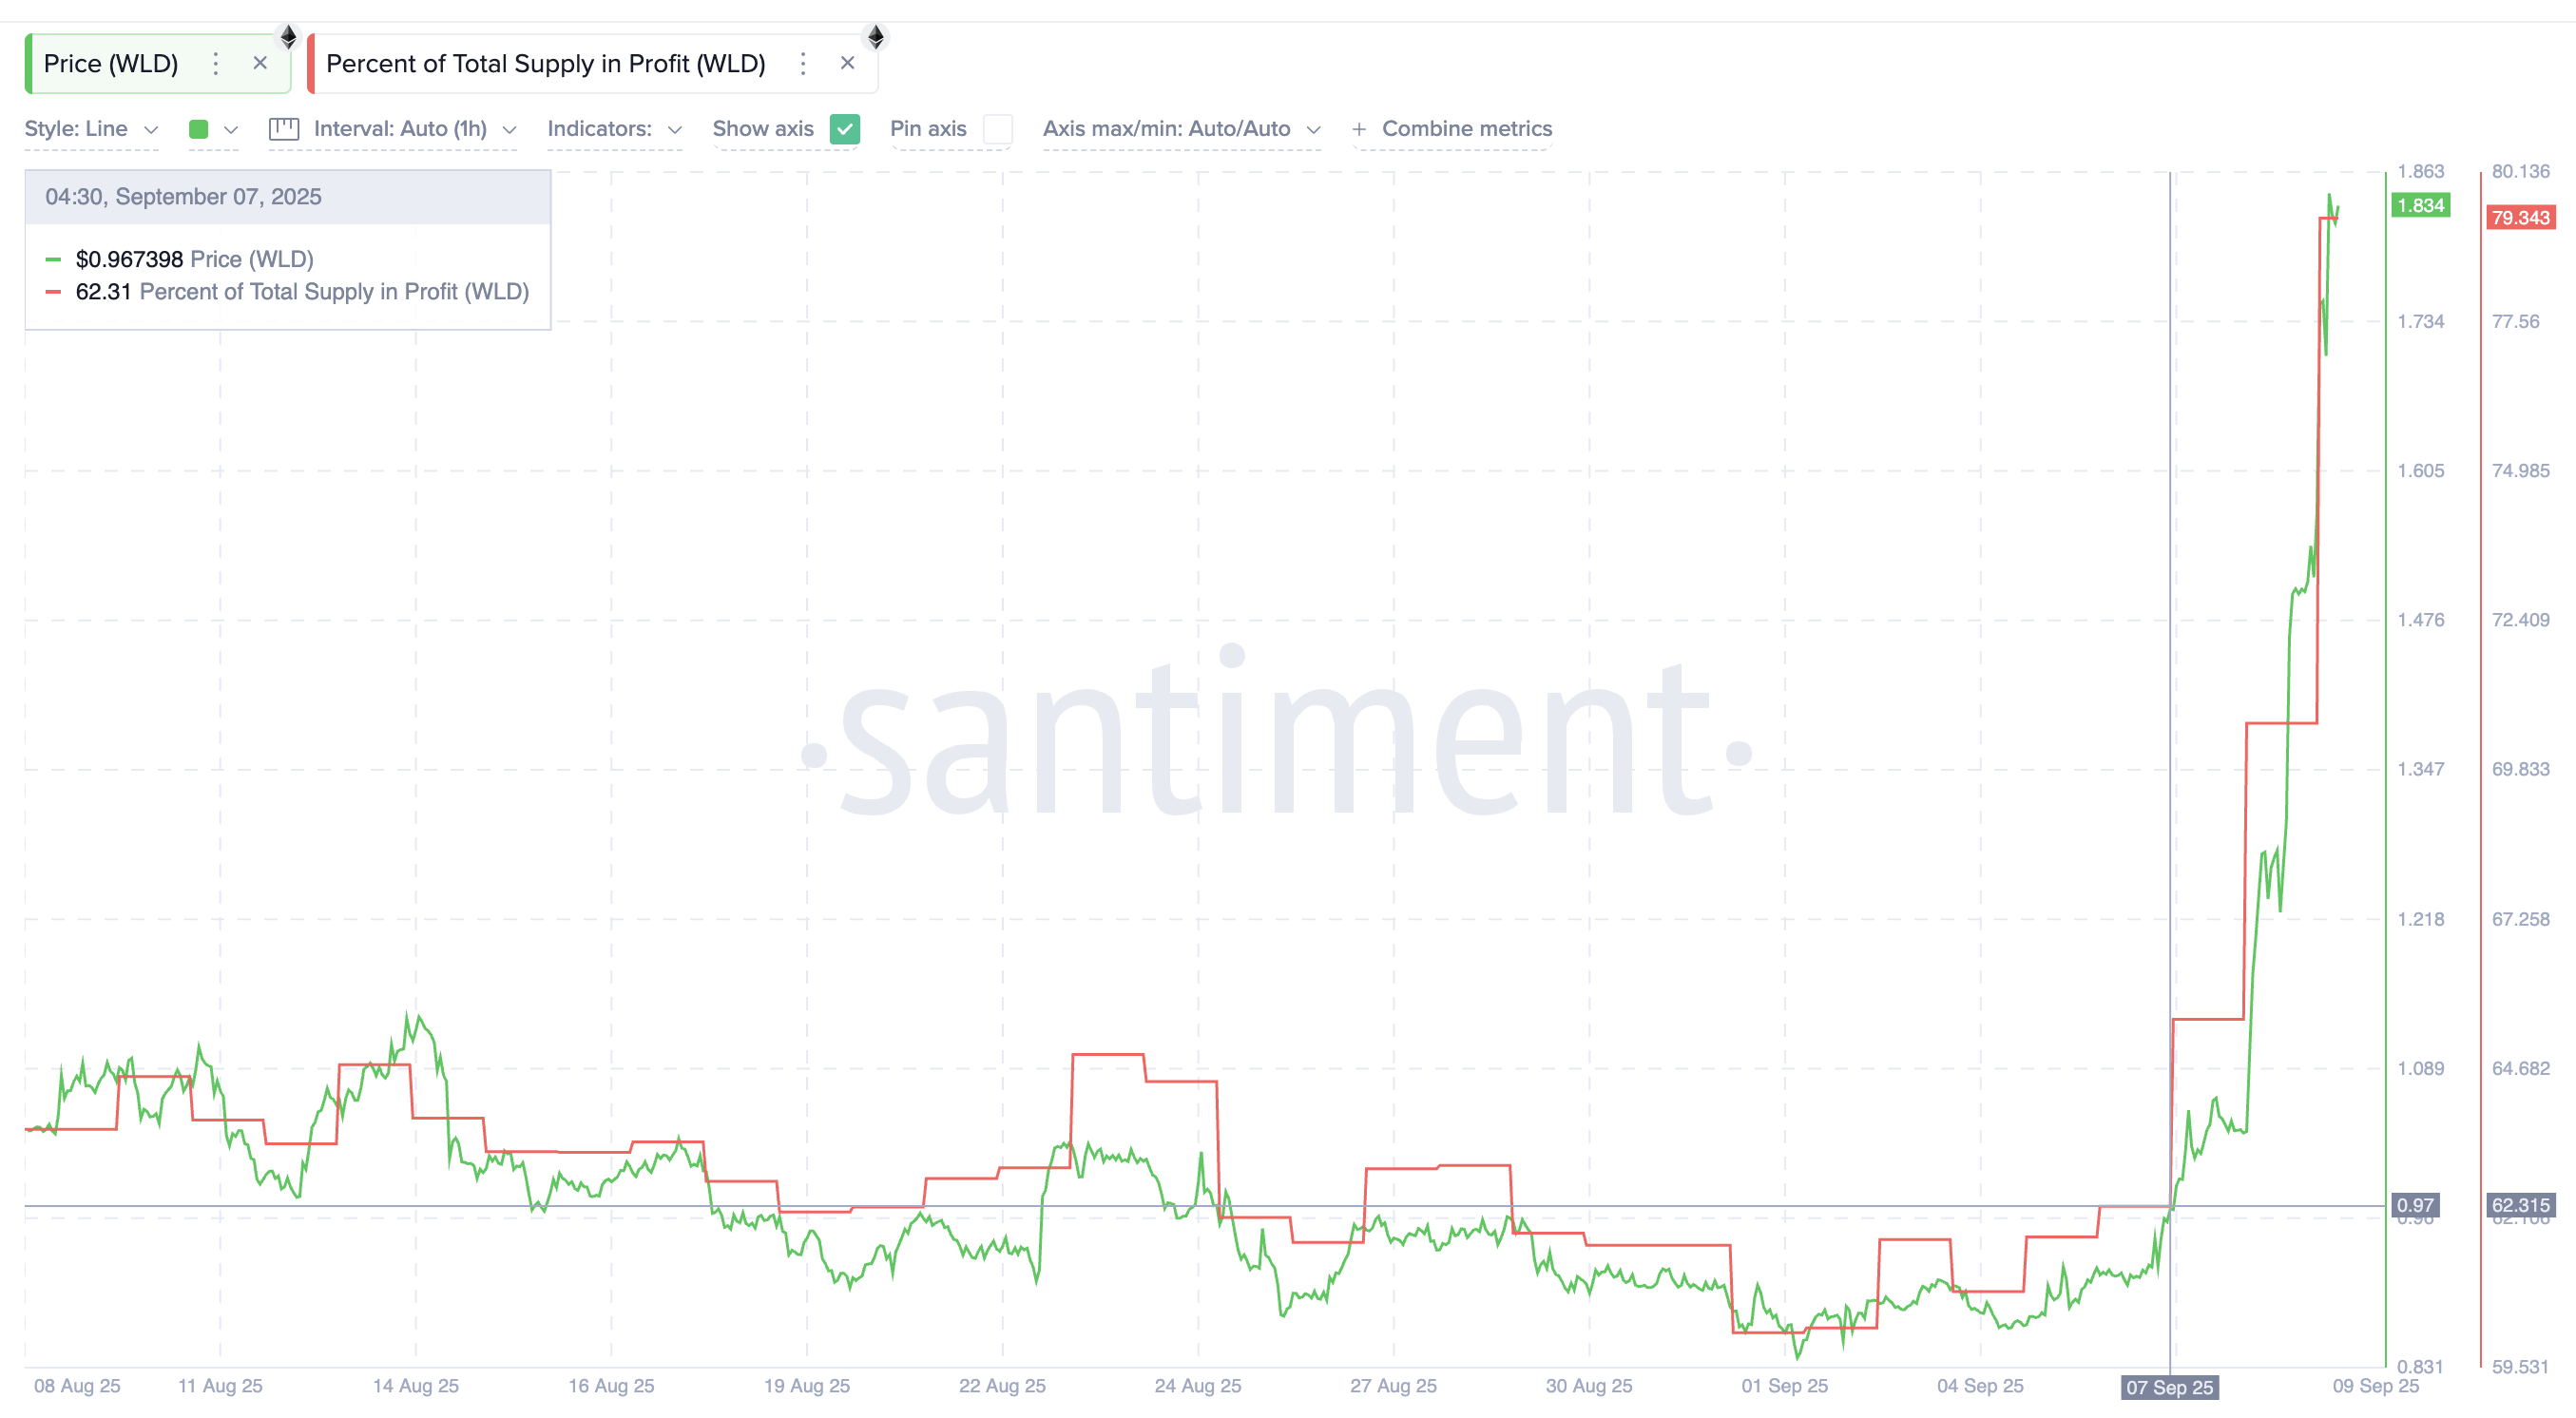 Total WLD Supply In Profit Surges:
Santiment
Total WLD Supply In Profit Surges:
Santiment
Meanwhile, whales have been adding. Their holdings climbed from 7.30 million to 7.93 million WLD, a net increase worth about $1.15million.
When compared, the inflows to exchanges exceeded the whale accumulation, resulting in a net selling pressure of over $9.5 million. And that too without taking smart money and top 100 addresses into consideration, as both these cohorts have also dumped over the past 24 hours.
This imbalance explains why the WLD price could stall in the short term.
Want more token insights like this? Sign up for Editor Harsh Notariya’s Daily Crypto Newsletter.
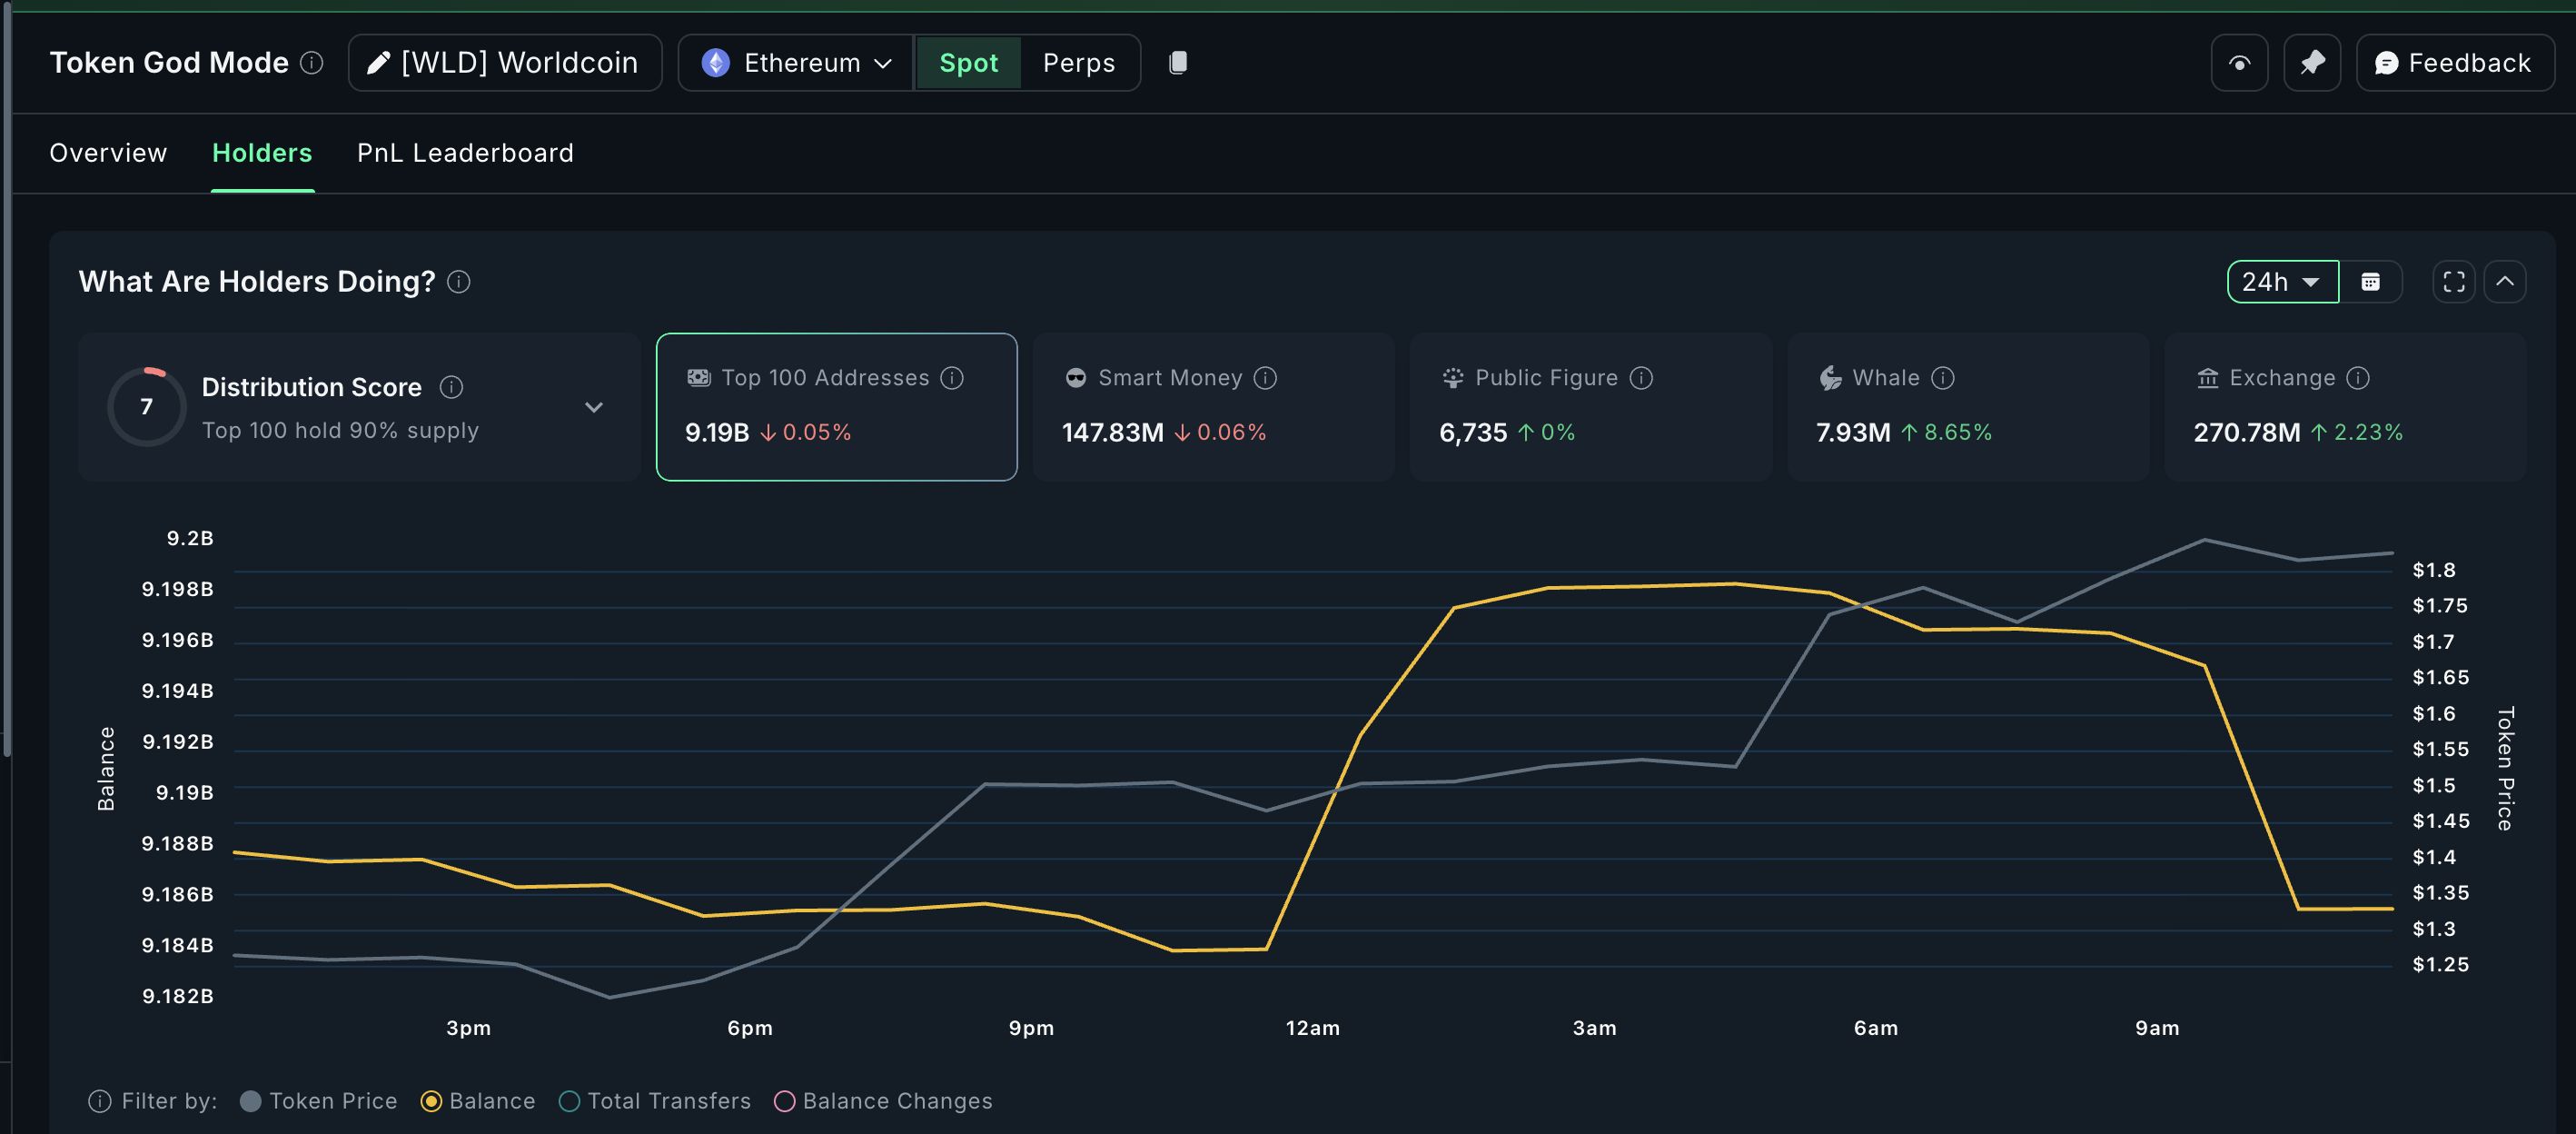 WLD Buying Pressure Is Fading:
Nansen
WLD Buying Pressure Is Fading:
Nansen
The Relative Strength Index (RSI) adds weight to this view. RSI, which measures whether an asset is overbought or oversold, is now the most overheated since early 2024. That makes a correction likely, though we’ll explore the RSI implications further in the price section below.
Dip Buying Shows Why This Could Be a Healthy Correction
Despite the selling pressure, demand is not absent. The Money Flow Index (MFI), which tracks whether inflows outweigh outflows, has surged to its highest level since early 2024. A rising MFI while price consolidates suggests that buyers — particularly whales — are absorbing every small dip.
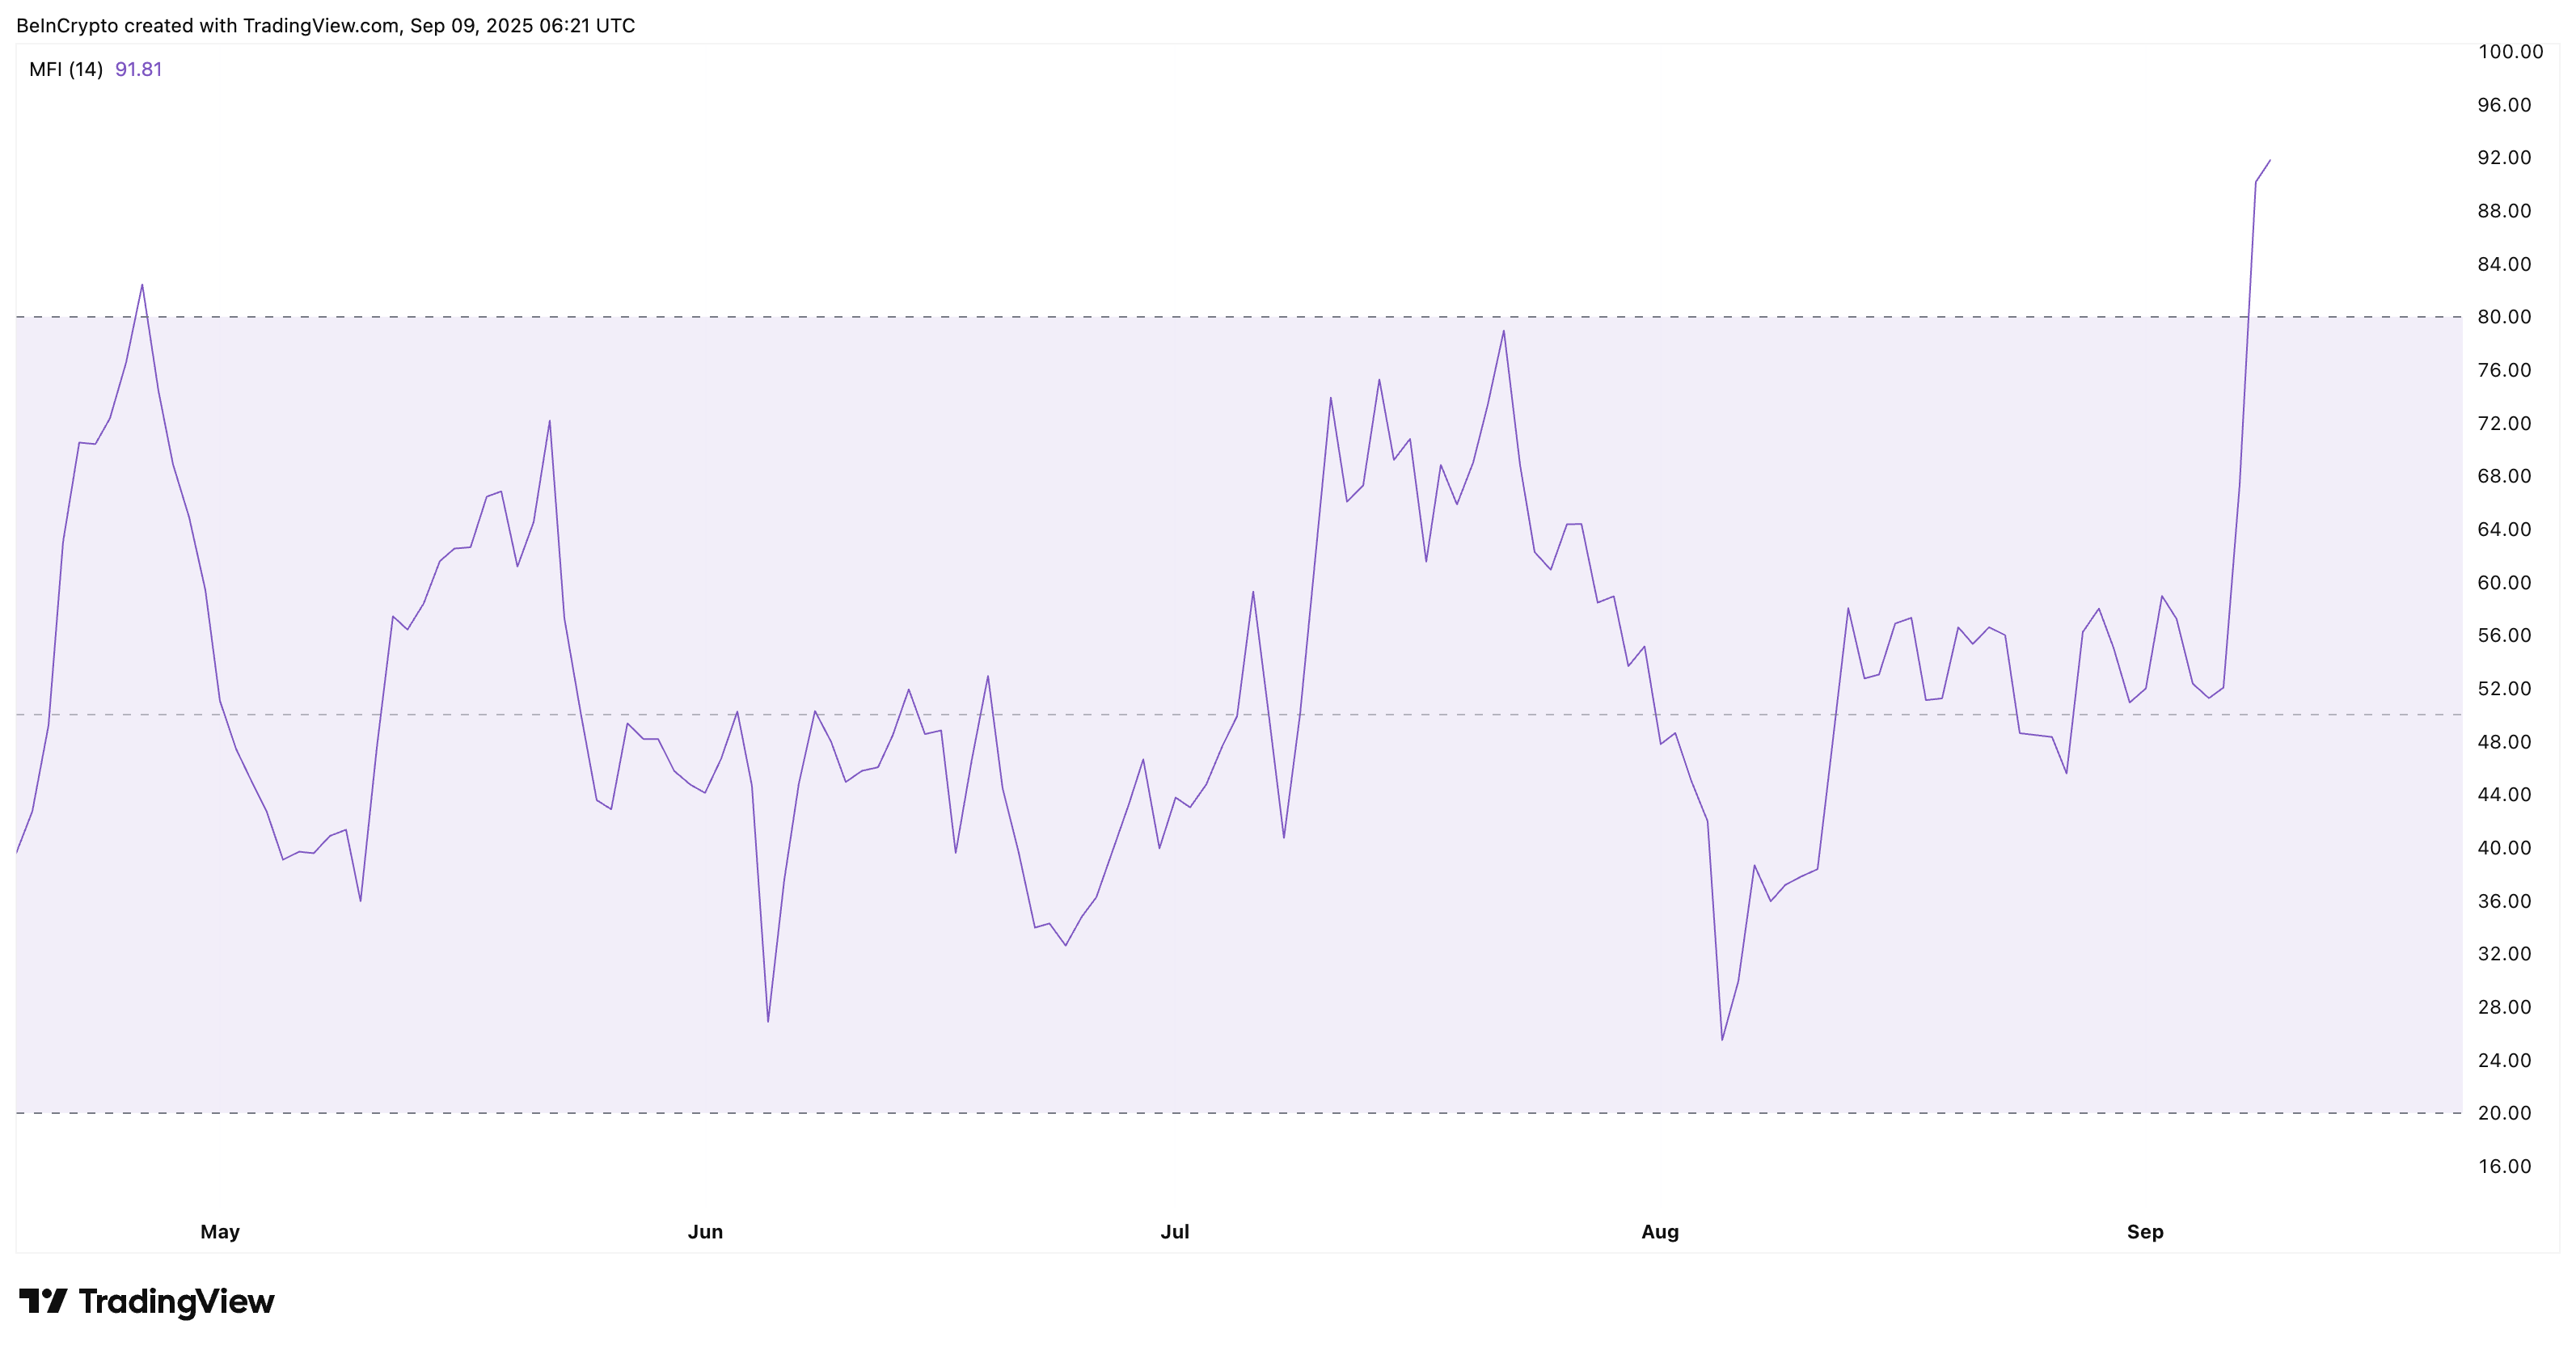 Worldcoin Dip Buying Continues
. Source:
TradingView
Worldcoin Dip Buying Continues
. Source:
TradingView
This is important because MFI strength often signals that corrections are shallow. When profit-taking sparks a pullback, dip buyers typically step in quickly to limit downside.
In WLD’s case, this steady inflow means that even if the price cools after its unworldly rally, the correction may not deepen into a collapse. Instead, it looks more like a pause before testing higher levels.
WLD Price Chart Validates a Healthy Pullback
The WLD price chart supports this balanced outlook. As noted earlier, RSI is stretched (in the overbought territory), confirming that a near-term dip is due. However, WLD continues to trade in a bullish setup, as its moving averages are flashing strength.
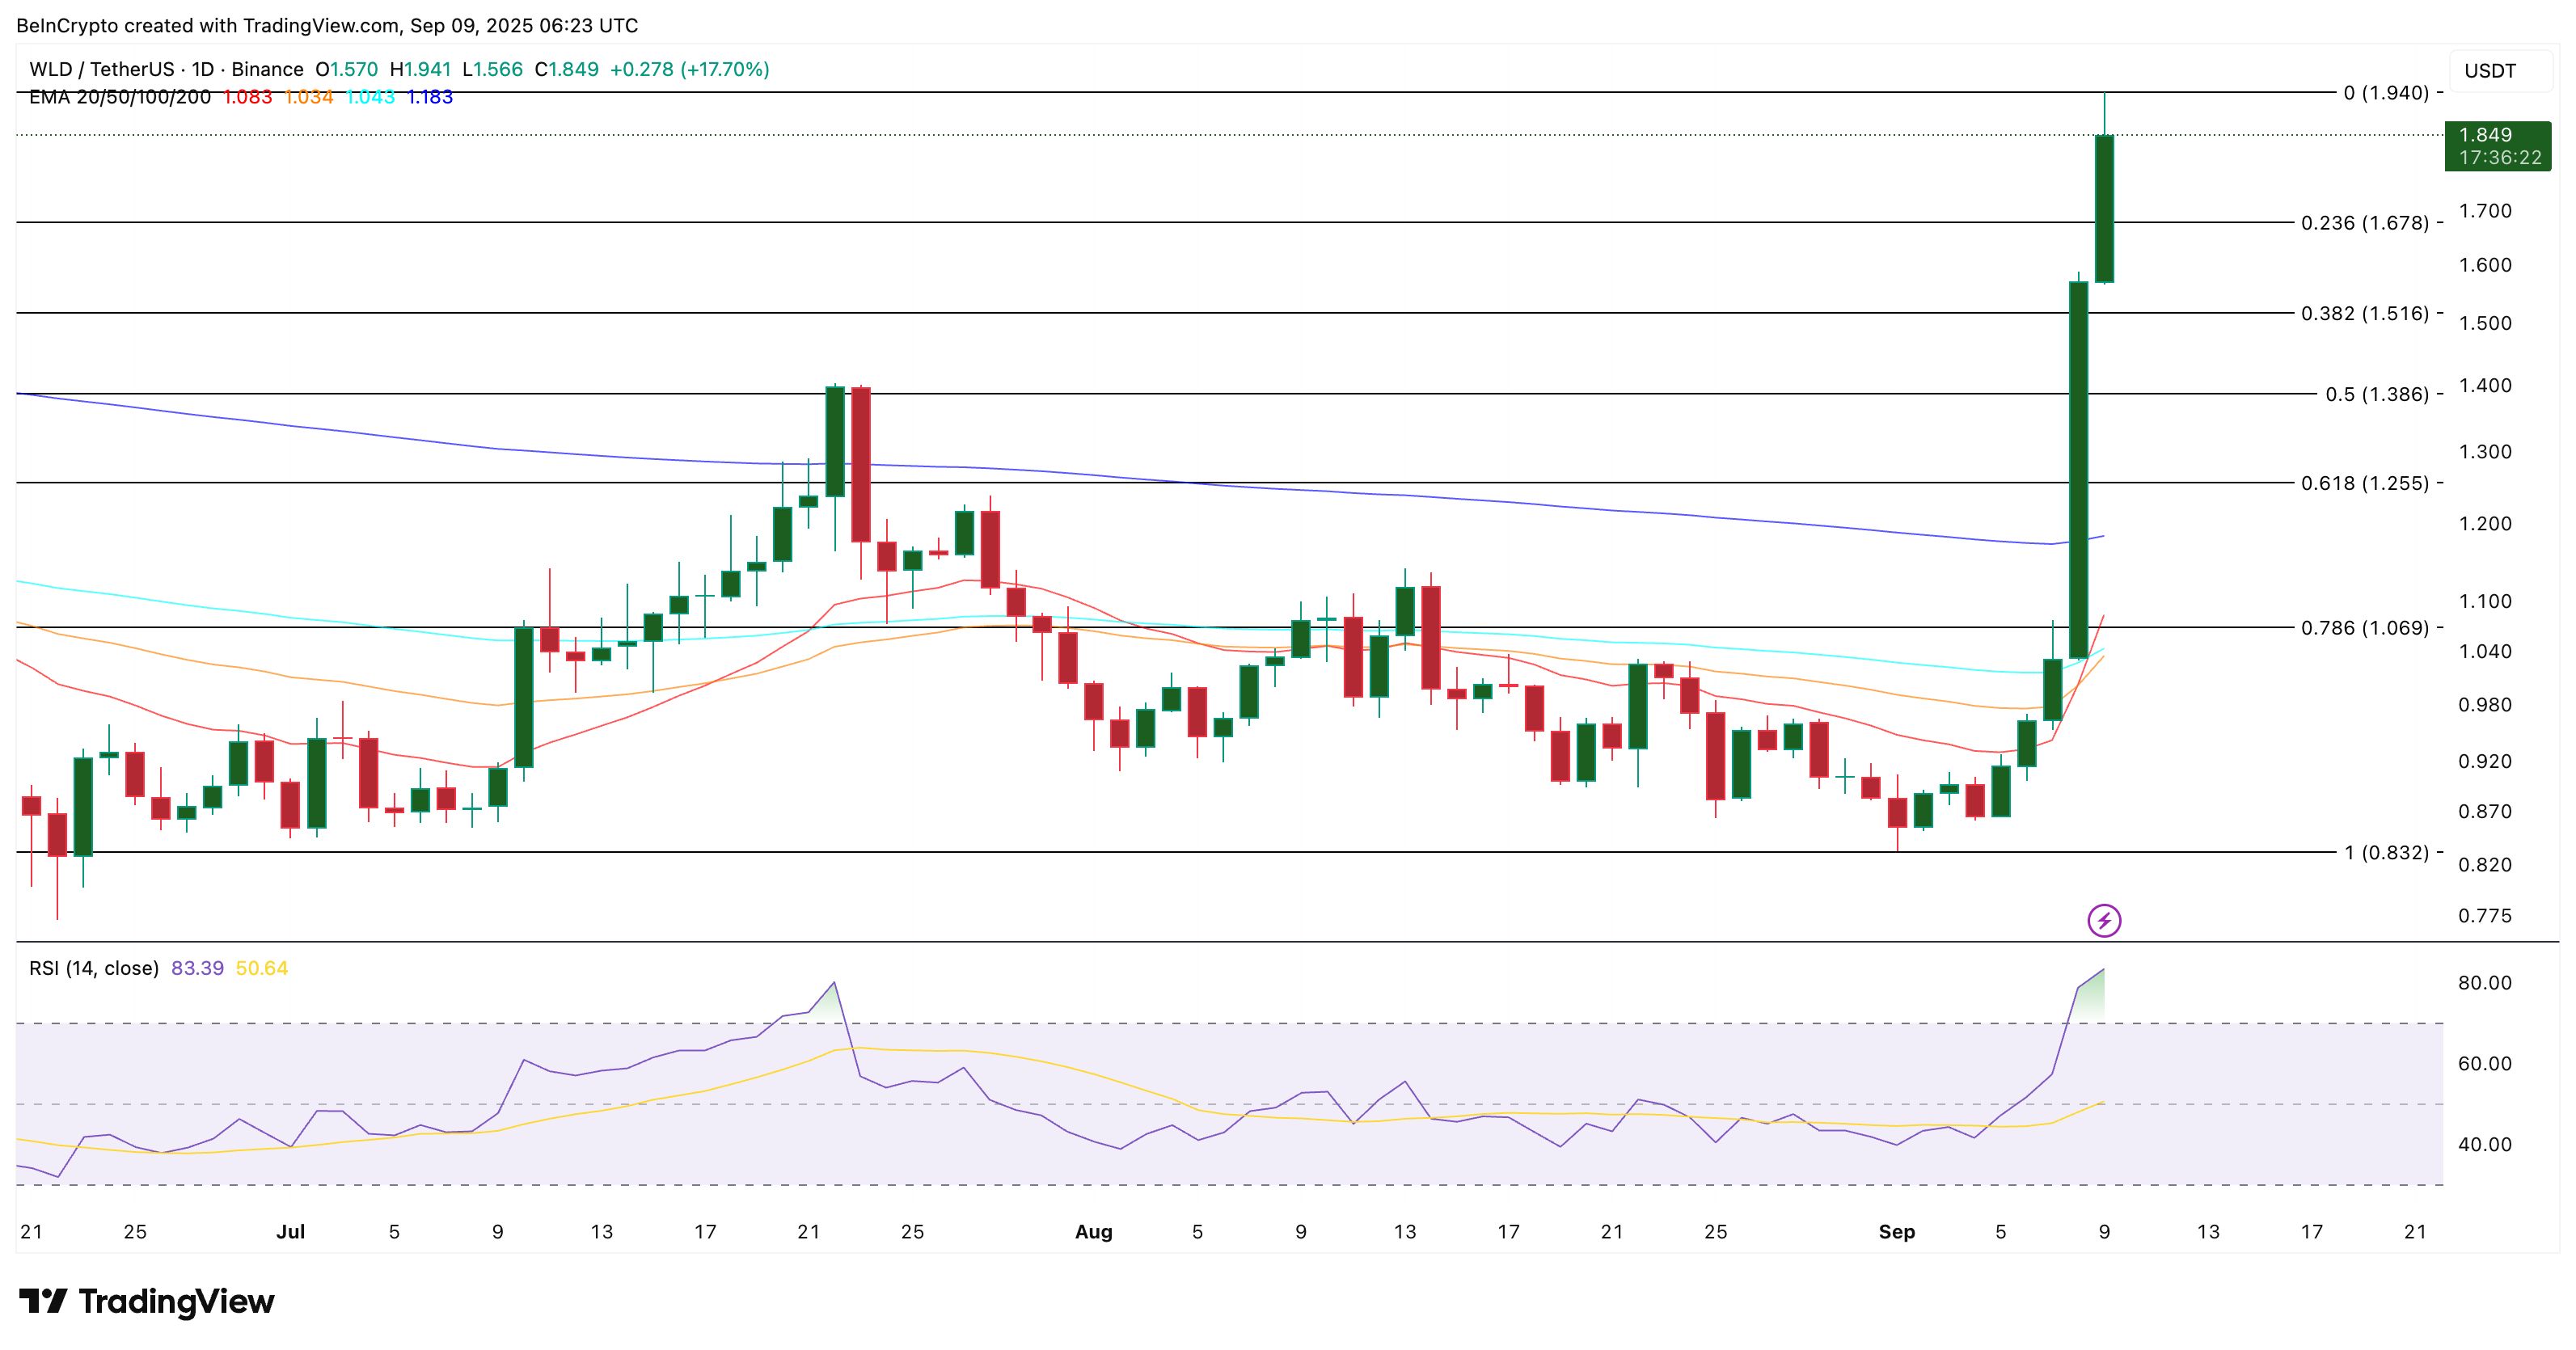 WLD Price Analysis:
TradingView
WLD Price Analysis:
TradingView
The 50-day Exponential Moving Average (EMA) or the orange line, which reacts faster to price changes, is closing in on the slower 100-day EMA (sky blue line). If the 50-day crosses above, it would form a “golden cross” — a signal often tied to extended bullish trends. Multiple golden crosses in past rallies have preceded days of upside, making this a key structure to watch.
The expectations of the bullish crossover forming during the pullback could add to the “healthy correction” narrative.
For levels, $1.38 remains the nearest strong support. If that breaks, the correction could deepen to $1.06. On the upside, a clean daily close above $1.94 would cancel the pullback scenario altogether, likely pushing the WLD price toward fresh highs.
Disclaimer: The content of this article solely reflects the author's opinion and does not represent the platform in any capacity. This article is not intended to serve as a reference for making investment decisions.
You may also like
US CPI Heats Up Across the Board, Triggering "Inflation Spiral" Alert; October Rate Hike Odds Once Hit 50%. "New Fed News Agency": Watch Waller's Speech This Week
After the CPI was released, the market-implied rate hike probability first rose to 50% before falling back to 40%. Wall Street generally believes that whether action will be taken in October still depends on how the Federal Reserve assesses inflation trends. "The New Fed News Agency" noted that, unlike in August when price increases were concentrated in certain items, the stronger-than-expected performance of September's core CPI was more broad-based, further reinforcing the case for a December rate hike. The speech by Waller on Friday morning Beijing time is his last public statement before the Fed's blackout period ahead of this month's meeting. Economists are warning about an "inflation spiral," with real purchasing power and midterm election pressures interweaving.
The calm period in the US stock market is over! The S&P 500 ends its record of 53 consecutive trading days without a drop of over 1%. AI stock sell-off intensifies market concerns.
The S&P 500 Index fell by 1.1%, ending a streak of 53 consecutive trading days without a drop of 1% or more. This was the longest period of calm since January 2020.
Federal Reserve Beige Book: U.S. economy expands moderately but inflationary pressures intensify; AI boosts productivity curbing some corporate hiring demand
The latest Beige Book released by the Federal Reserve on Wednesday shows that overall economic activity in the United States continues to grow, but performance varies across regions. Consumer spending remains generally weak, and there has been little change in the labor market.
Overnight US Stocks | September Inflation Remains High, Major Indexes Decline, Coreweave (CRWV.US) Drops Over 15%
At the close, the Dow Jones Industrial Average fell by 47.96 points, or 0.09%, to 51,622.14 points; the S&P 500 Index dropped by 85.95 points, or 1.10%, to 7,719.50 points; and the Nasdaq Composite Index declined by 511.51 points, or 1.88%, to 26,692.87 points.
Crypto prices
More


