

Bitcoin vs gold: gold has surged to a record above $3,640 as of Sept 2025, while Bitcoin remains range-bound near $112,600; investors face a short-term allocation choice between gold’s breakout momentum and Bitcoin’s stalled recovery.
-
Gold hit an all-time high above $3,640, driven by central bank demand and macro risk.
-
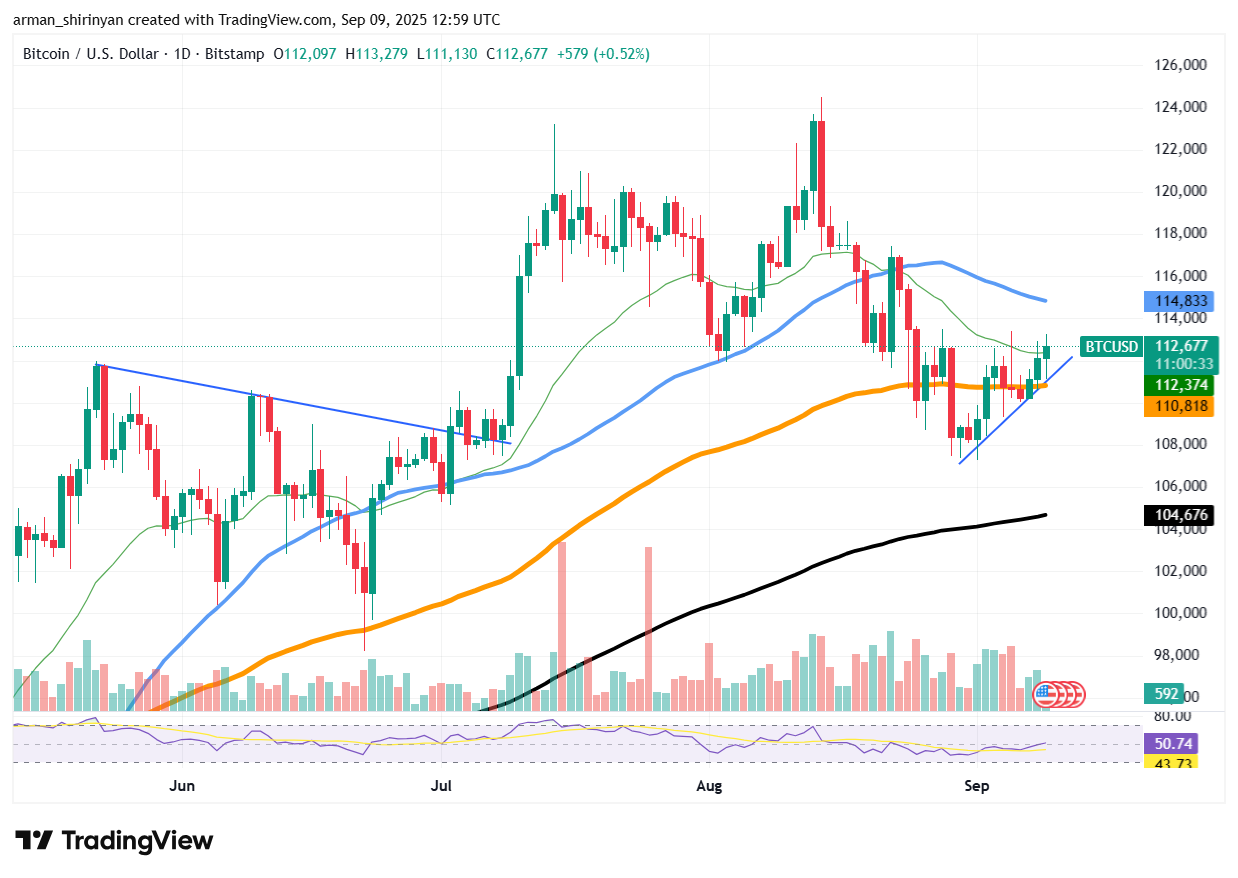
Bitcoin is consolidating near $112,600 with resistance at $114,800–$116,000 and limited volume support.
-
Gold’s RSI >80 indicates strong momentum; Bitcoin’s RSI is neutral, suggesting higher retracement risk.
Meta description: Bitcoin vs gold: Gold tops $3,640 as Bitcoin stalls near $112,600—read analysis and allocation guidance from COINOTAG.
What is driving the Bitcoin vs gold divergence?
Bitcoin vs gold divergence is driven by gold’s renewed safe-haven demand and central bank purchases while Bitcoin remains range-bound, failing to break key resistances. Gold’s breakout above $3,640 shows strong momentum; Bitcoin’s limited volume and resistance at $114,800 signal stalled upside in the near term.
How has gold performed recently?
Gold entered a parabolic rally, breaking past $3,454 and reaching above $3,640. Momentum indicators, including the Relative Strength Index (RSI), are showing readings above 80, reflecting extreme bullishness. Central bank purchases, inflation hedging and geopolitical risk continue to underpin the trend.
BTC/USDT Chart by TradingView
Technical structure suggests that any pullback toward $3,450–$3,500 could be consolidation before further gains. Market participants referencing official central bank data and recent public statements (plain text references: International central bank purchase reports) see continued demand as a credible support for higher prices.
Why is Bitcoin lagging behind?
Bitcoin is trapped in a consolidation range around $112,600. Immediate resistance sits at $114,800 where the 50-day EMA limits upside. Volume profiles show muted buying pressure, and the RSI near neutral implies susceptibility to retracement if macro flows favor safe havens like gold.
Key technical levels to watch: support at $110,800, breakout threshold at $116,000, and the 200-day EMA near $104,600. Failure to close and hold above $116,000 would likely keep digital-asset momentum subdued relative to precious metals.
How should investors approach capital allocation now?
Front-load safety and liquidity in the short term if risk tolerance is low. For active allocators, use staged rebalancing: increase defensive exposure to gold on momentum confirmation and set clear triggers for re-entering Bitcoin on volume-backed breakouts.
| Price (recent) | $3,640+ | $112,600 (range-bound) |
| RSI | >80 (overbought) | ~50 (neutral) |
| Key support | $3,450–$3,500 | $110,800 |
| Key resistance | Previous highs (parabolic) | $114,800–$116,000 |
Frequently Asked Questions
Is gold outperforming Bitcoin right now?
Yes. Gold is outperforming Bitcoin in the current short-term window thanks to record highs above $3,640 and strong momentum indicators, while Bitcoin remains confined to a consolidation range around $112,600 with limited buying volume.
Will Bitcoin drop to the 200-day EMA?
If Bitcoin fails to break and sustain above $116,000, a retracement toward the 200-day EMA near $104,600 is possible, especially if macro flows continue to favor traditional safe havens like gold.
How can I rebalance between gold and Bitcoin?
Rebalance via staged allocations: (1) add defensive gold exposure on confirmed momentum, (2) set stop-losses for crypto exposure, (3) use volume-confirmed breakouts to re-add Bitcoin, and (4) maintain liquidity for opportunistic entries.
Key Takeaways
- Gold’s leadership: Gold has reached record highs and shows strong momentum supported by central bank demand.
- Bitcoin consolidation: Bitcoin remains range-bound near $112,600 and needs a breakout above $116,000 to regain momentum.
- Allocation action: Consider staged rebalancing favoring gold on momentum confirmation and wait for volume-backed Bitcoin breakouts for re-entry.
Conclusion
Gold’s clean uptrend and record highs contrast with Bitcoin’s stalled recovery, creating a clear near-term allocation question for investors. COINOTAG analysts recommend monitoring $116,000 for Bitcoin and watching gold’s $3,450–$3,500 zone for consolidation signals. Stay disciplined with triggers and risk controls.


