
Bitcoin Price at Risk Despite September Bounce — 3 Warning Signs Emerge for BTC

Bitcoin price is holding near $111,800 after a solid start to September, but on-chain and chart signals suggest defending $110,500 may be tougher than it looks.
Bitcoin is holding near $112,100, up about 1% in the past week. The move from $107,200 to $112,100 shows September kicked off with some relief after August’s over 6% drop. Traders welcomed the bounce, but the bigger picture still leans negative.
Bitcoin is down about 9% month-on-month, and fresh signals suggest the bears are not done yet. The question is simple: can Bitcoin defend $112,000, or will the trend roll back over?
Long-Term Holders Are Cutting Back While Whales Return To Exchanges
The first warning sign comes from long-term holders. These wallets usually build conviction and rarely sell into weakness. But that picture has changed since mid-July.
On July 13, they held 14.72 million BTC. By early September, that number had slid to 14.43 million BTC, the lowest in three months.
Roughly 290,000 BTC, leaving strong hands, is not a small figure; it shows that even patient holders are reducing risk or selling into each price rebound.
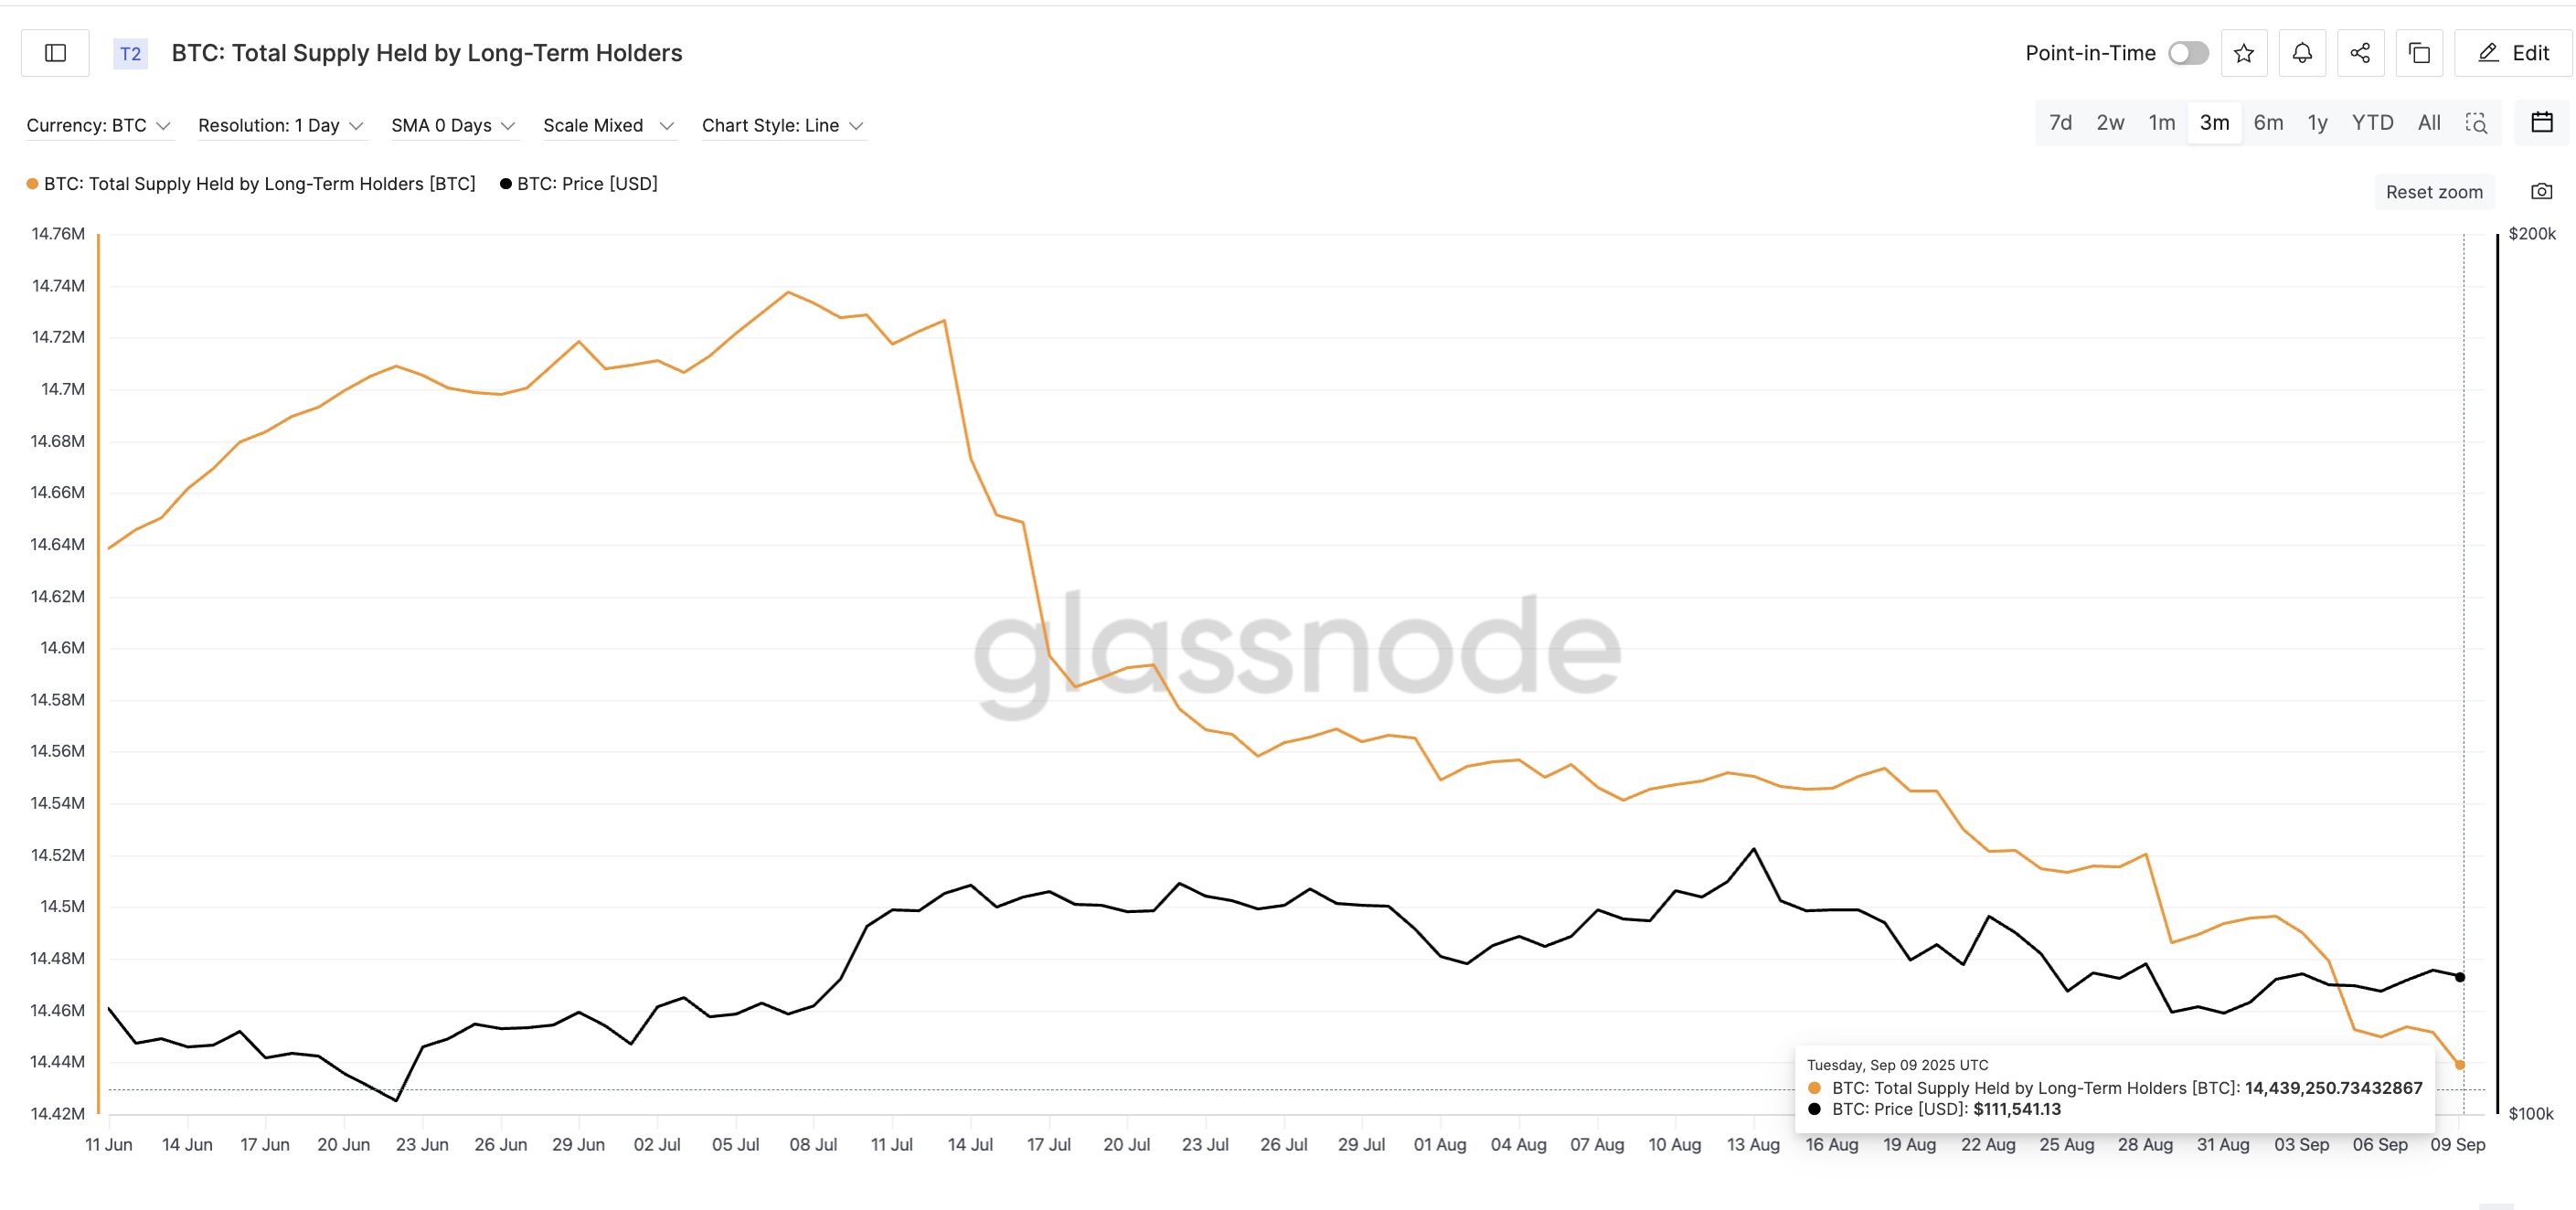 Bitcoin Long-Term Holders Dropping Supply:
Glassnode
Bitcoin Long-Term Holders Dropping Supply:
Glassnode
Meanwhile, whales are back in the spotlight. The exchange whale ratio — which tracks how much of the inflows come from the 10 largest wallets — has climbed from 0.44 on September 5 to 0.53 at press time.
The last time it hit similar levels, on August 21, Bitcoin dropped from $116,900 to $108,300 within the next few days.
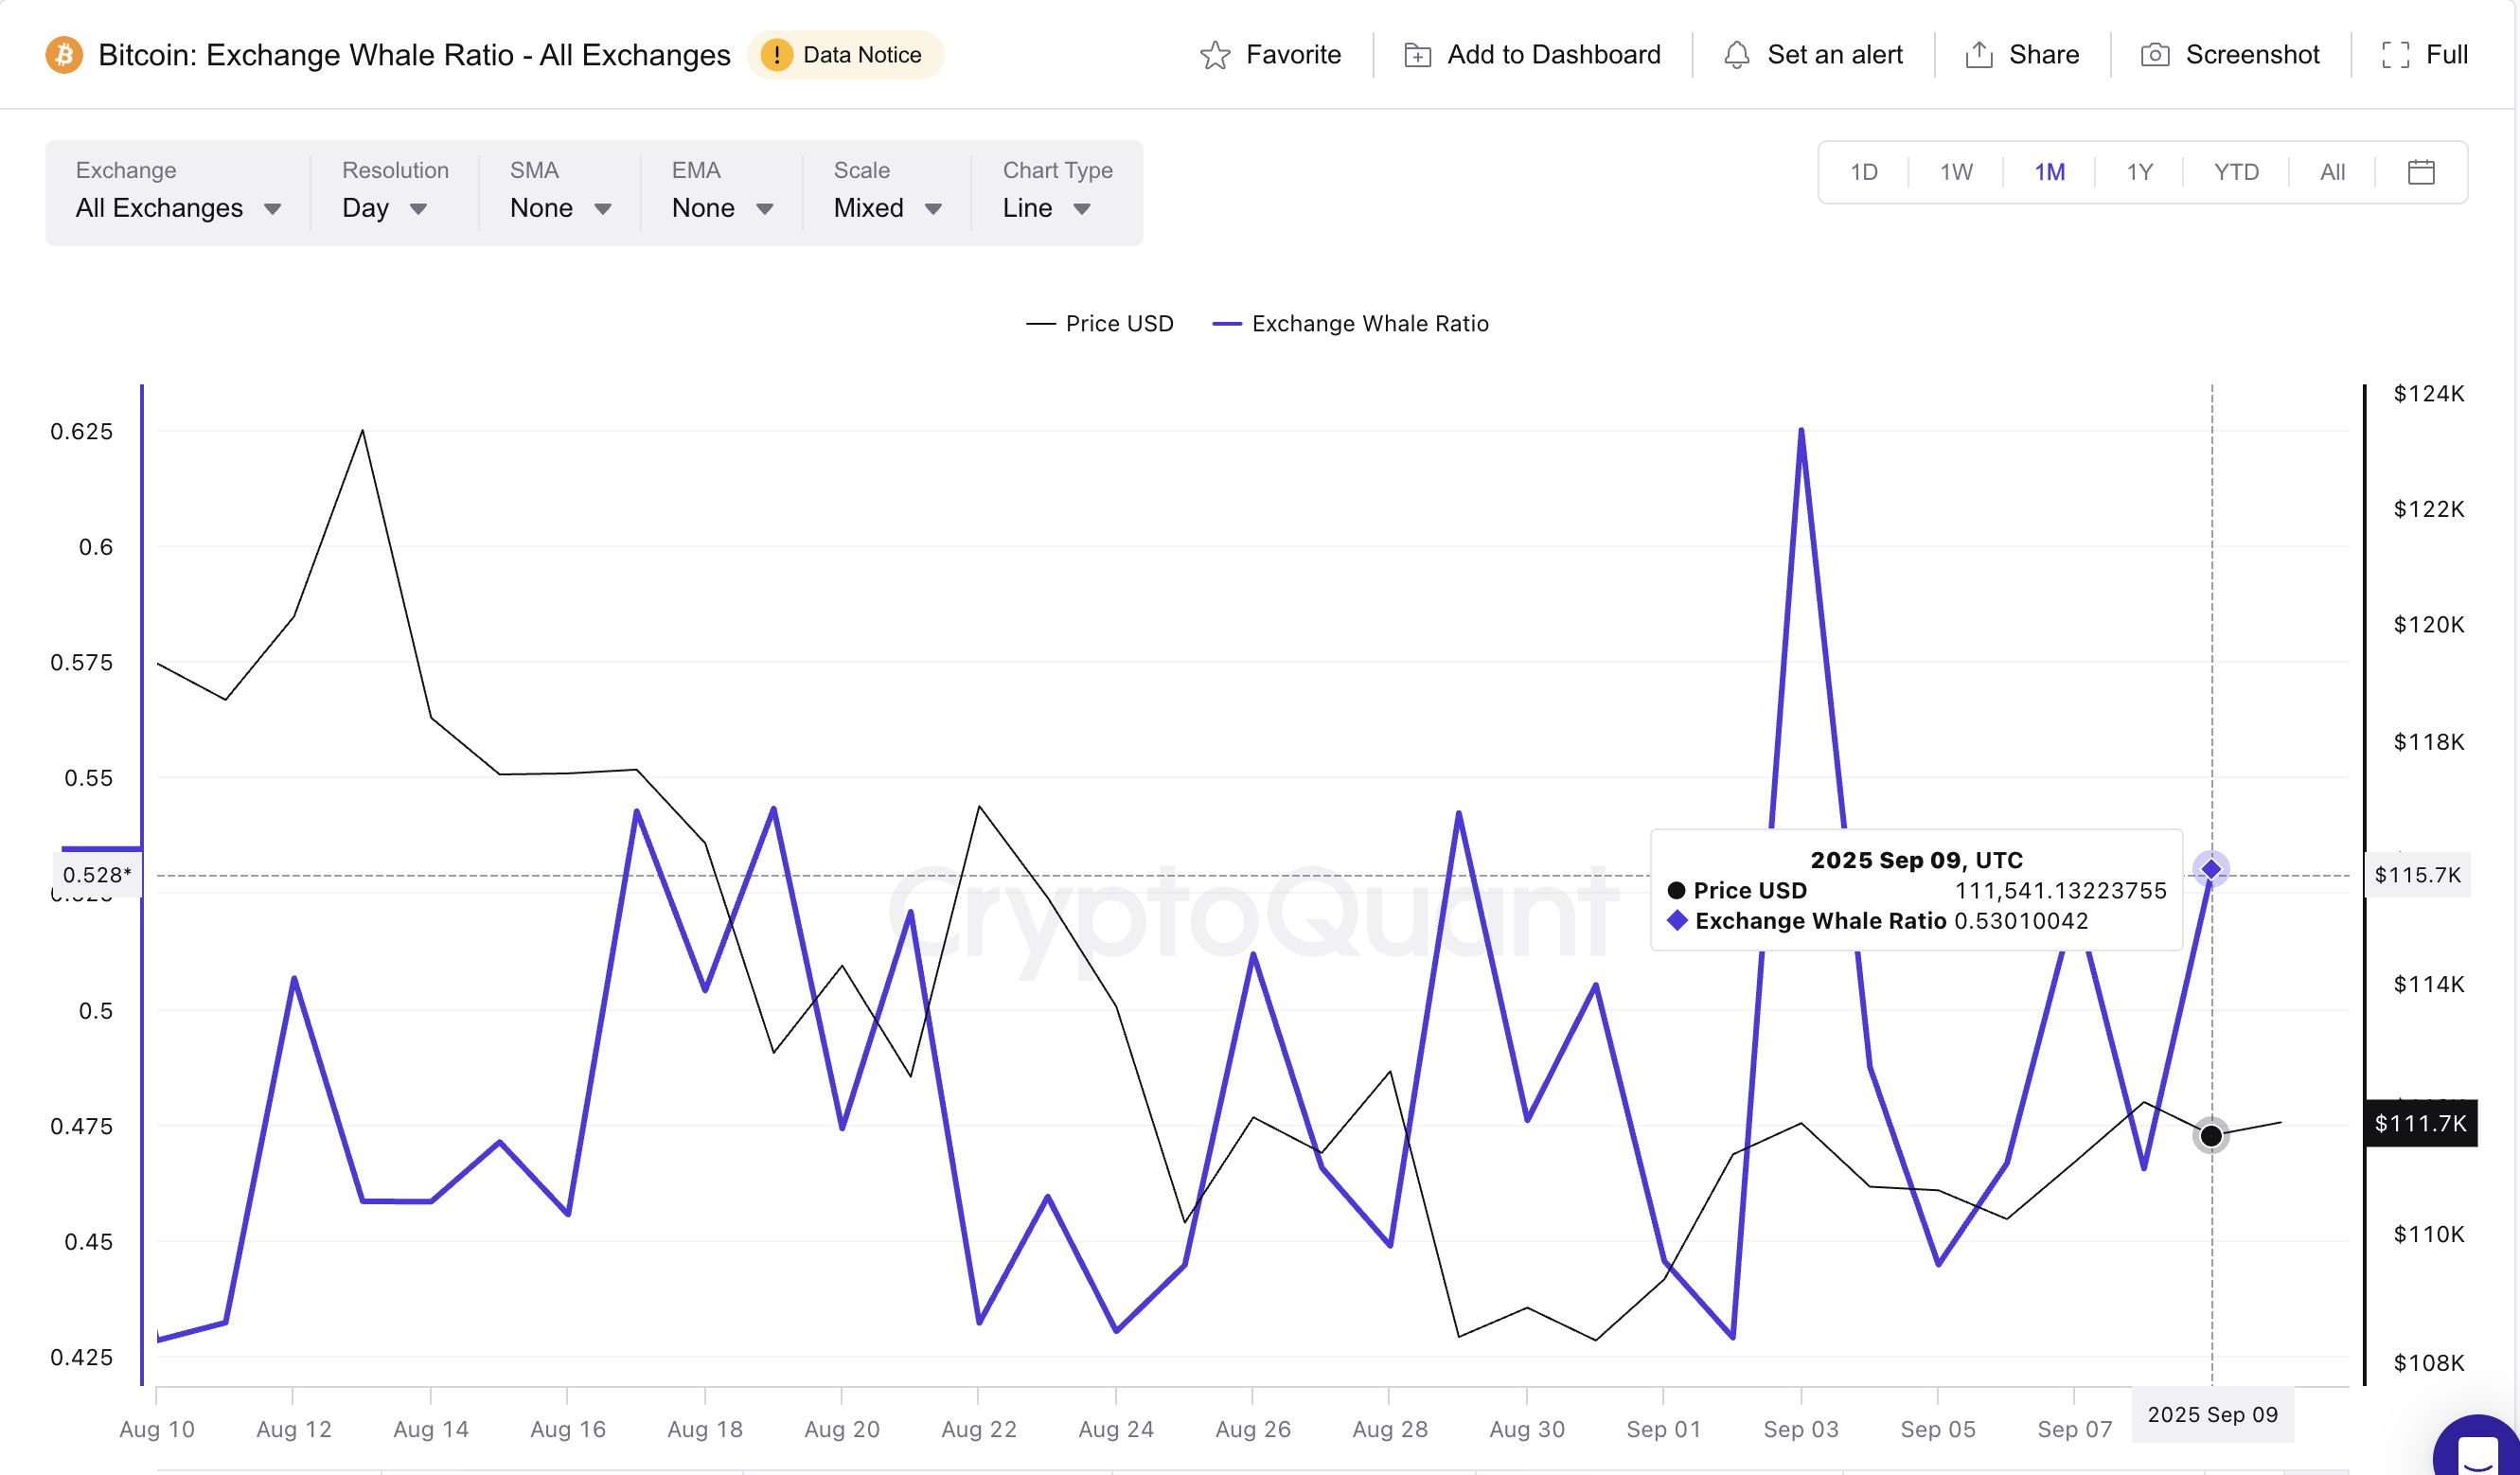 Bitcoin Whales Keep Pushing BTC To Exchanges:
CryptoQuant
Bitcoin Whales Keep Pushing BTC To Exchanges:
CryptoQuant
Want more token insights like this? Sign up for Editor Harsh Notariya’s Daily Crypto Newsletter here.
The monthly Exchange Whale ratio chart also highlights something interesting. It shows that whales have not let up over the past 30 days, moving BTC to exchanges even on the smallest of price rises. The multiple local indicator peaks can validate this.
Put together, long-term holders trimming their stash and whales pushing coins onto exchanges repeatedly is not a bullish mix. It signals that supply is being readied in case prices weaken further.
Bearish Divergence On The Bitcoin Price Chart Backs The Case
The on-chain data lines up with the Bitcoin price chart. Between August 28 and September 8, Bitcoin’s price made lower highs, while the Relative Strength Index (RSI) — a gauge of buying momentum — printed higher highs. This mismatch is called a hidden bearish divergence.
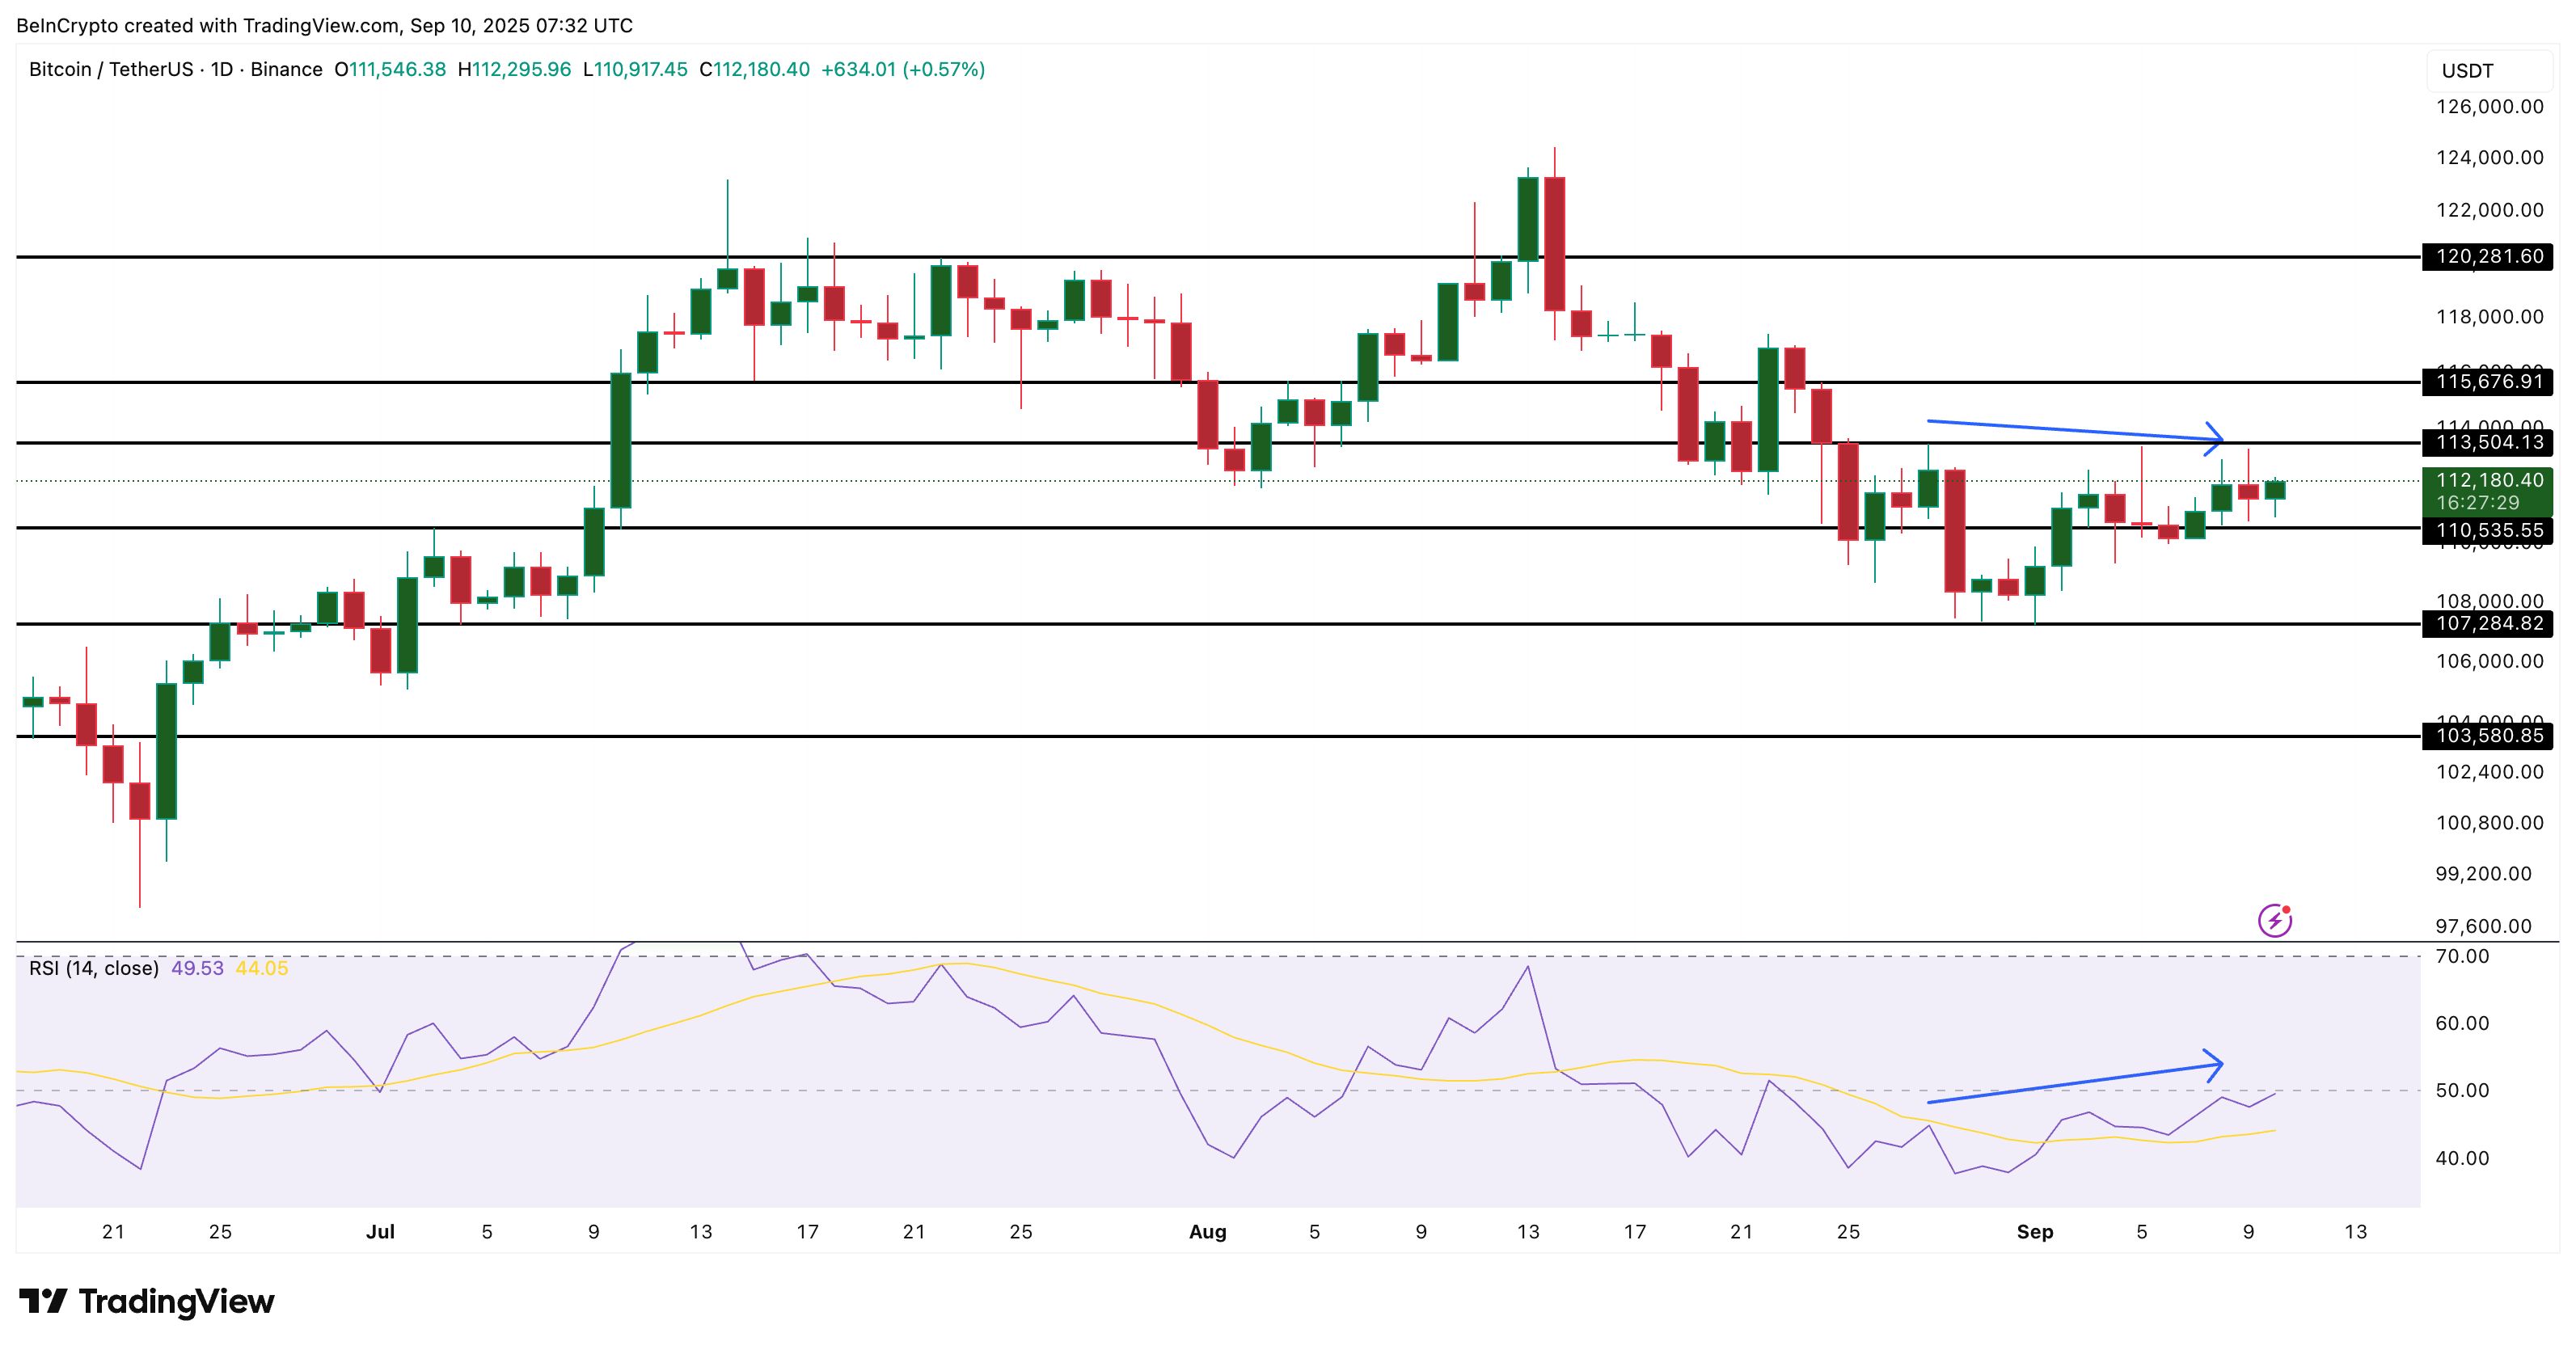 Bitcoin Price Analysis:
TradingView
Bitcoin Price Analysis:
TradingView
In other words, momentum looks like it’s improving, but the price action fails to follow. That often sets up the next leg lower.
For traders, the pattern usually warns of trend continuation to the downside, which could mean an extension of BTC’s month-on-month downtrend, as it’s down almost 9% in that timeframe.
The key level to defend for the Bitcoin price is $110,500. If that cracks, led by the bearish divergence and selling pressure, the door opens to $107,200, and if pressure builds, even $103,500 could come back into play.
On the other hand, a close above $113,500 would invalidate the RSI-led bearishness and give the bulls back control.
Disclaimer: The content of this article solely reflects the author's opinion and does not represent the platform in any capacity. This article is not intended to serve as a reference for making investment decisions.
You may also like
No one wants to hold this market, but Goldman Sachs believes this is exactly the entry signal: three major rescues are about to return
Market sentiment has dropped to the lows last seen on “Parity Tariff Day” in April, but Goldman Sachs’s flow team believes that technical conditions in US equities are quietly shifting. The corporate buyback window will reopen on a large scale from the end of October to November, mutual fund year-end selling pressure will dissipate after Halloween, and historical seasonal buying from retail and foreign investors will take over. Buybacks, retail investors, and foreign capital will all return almost simultaneously.
Boosted by AI boom, TSMC (TSM.US) is expected to achieve record profits for the sixth consecutive quarter in Q3, with the options market pricing in nearly 4% earnings volatility ahead of the financial report
The world's largest advanced semiconductor foundry, TSMC, will announce its third-quarter financial report on Thursday.

Anthropic’s performance is “good but not good enough”: under “adjusted profitability,” revenue growth sharply brakes!
Anthropic's third-quarter revenue reached $16.8 billion, an increase of nearly 50% quarter-over-quarter, and achieved "adjusted profitability"—but the market remains unconvinced. The main concern lies in monthly growth slowing sharply from 33% to single digits, leaving a gap of several billion dollars short of the year-end $100 billion target. Token prices have hit historic lows, with the disconnect between volume and price becoming increasingly prominent. Whether this "good but not good enough" performance can support a $2 trillion IPO valuation remains uncertain.
Crypto prices
More


