Ethereum price is trading near $4,515 after a 1.3% 24-hour gain; short-term charts show a false breakout around $4,558 and risk of a correction to $4,400–$4,500 if daily candles close below key support levels.
-
ETH price up 1.3% in 24h; current quote ~$4,515 — watch $4,558 resistance and $4,450 support.
-
Hour chart shows a false breakout; daily close will determine short-term trend direction.
-
Midterm range: $4,166 support — $4,788 resistance; sideways trading likely without a decisive breakout.
Ethereum price update: ETH price trades around $4,515 after a 1.3% rise; see support/resistance, technical outlook, and COINOTAG analysis.
The crypto market extended gains at the end of the week, according to CoinMarketCap, driven by renewed interest in major altcoins. Market breadth remains mixed while Bitcoin leads larger moves, keeping Ethereum price action range-bound for now.

Top coins by CoinMarketCap
How is the Ethereum price moving right now?
Ethereum price is trading near $4,515 after a 1.3% increase over the last 24 hours. Short-term momentum hit resistance at $4,558 with a false breakout on the hourly chart, and a decisive daily close will likely determine whether a pullback to $4,400–$4,500 occurs.
Why did ETH show a false breakout and what does it mean?
On the hourly chart, a move above $4,558 failed to sustain, creating a false breakout pattern. False breakouts often indicate short-term liquidity sweeps executed by larger participants. TradingView chart analysis shows rejection wicks at the resistance level, suggesting sellers defended $4,558.
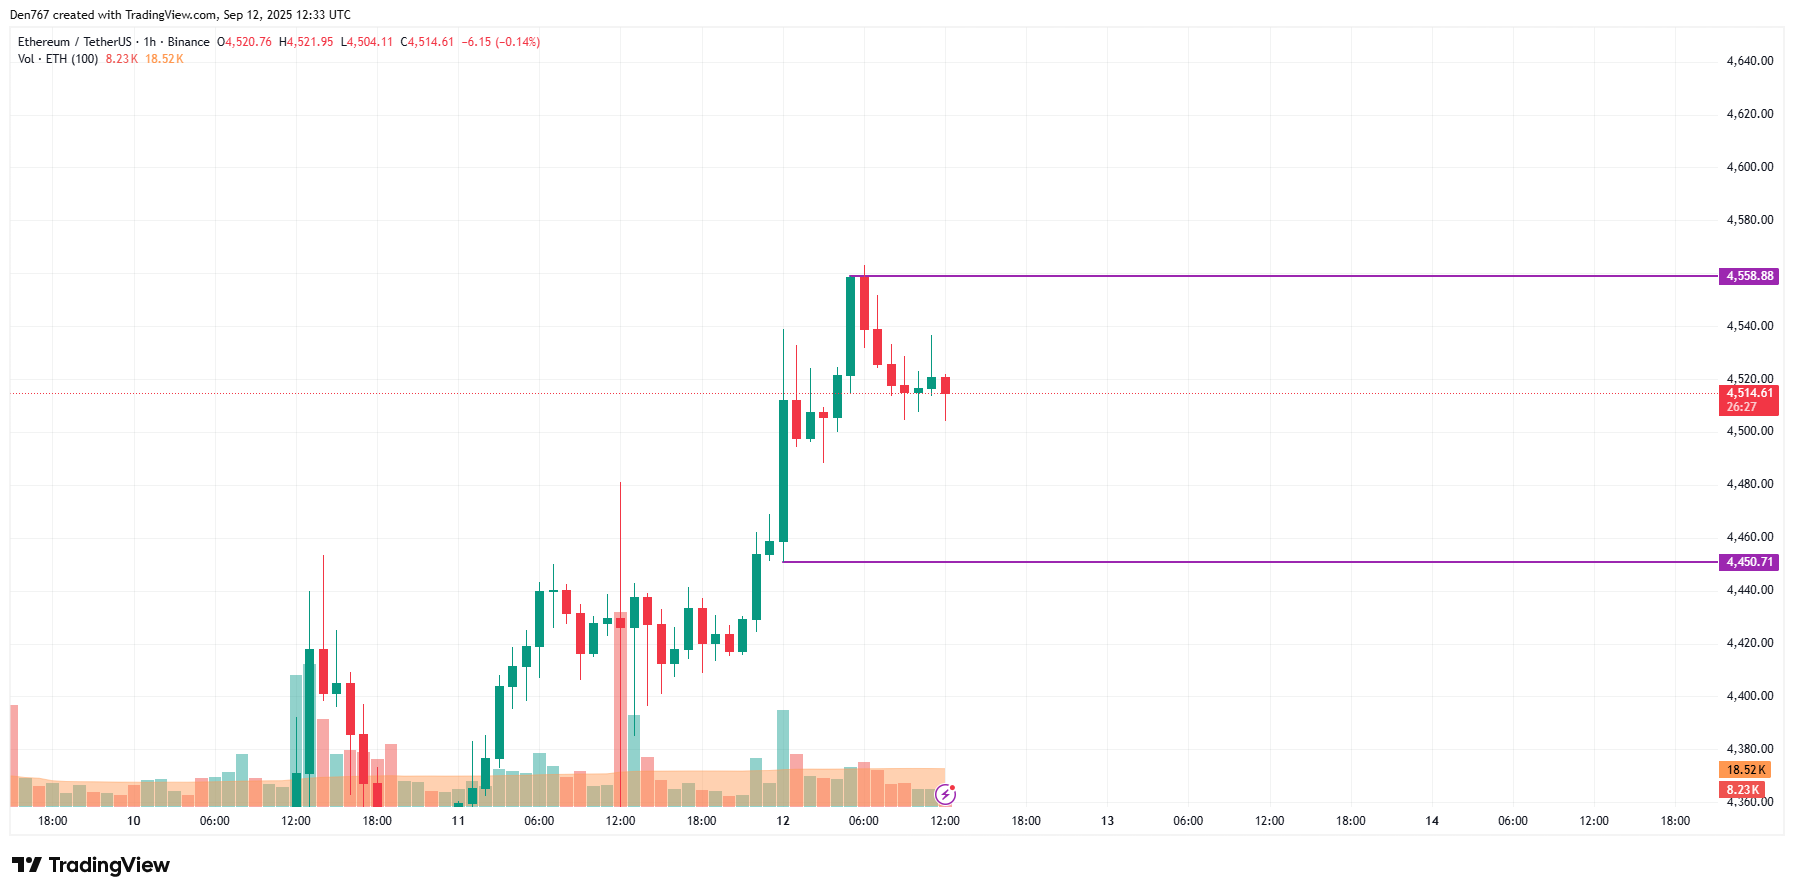
Image by TradingView
If the daily candle closes significantly below the $4,516 marker, bearish pressure could intensify. A daily close with a long upper wick would increase odds of a correction toward the $4,400–$4,500 support zone within the next few days.
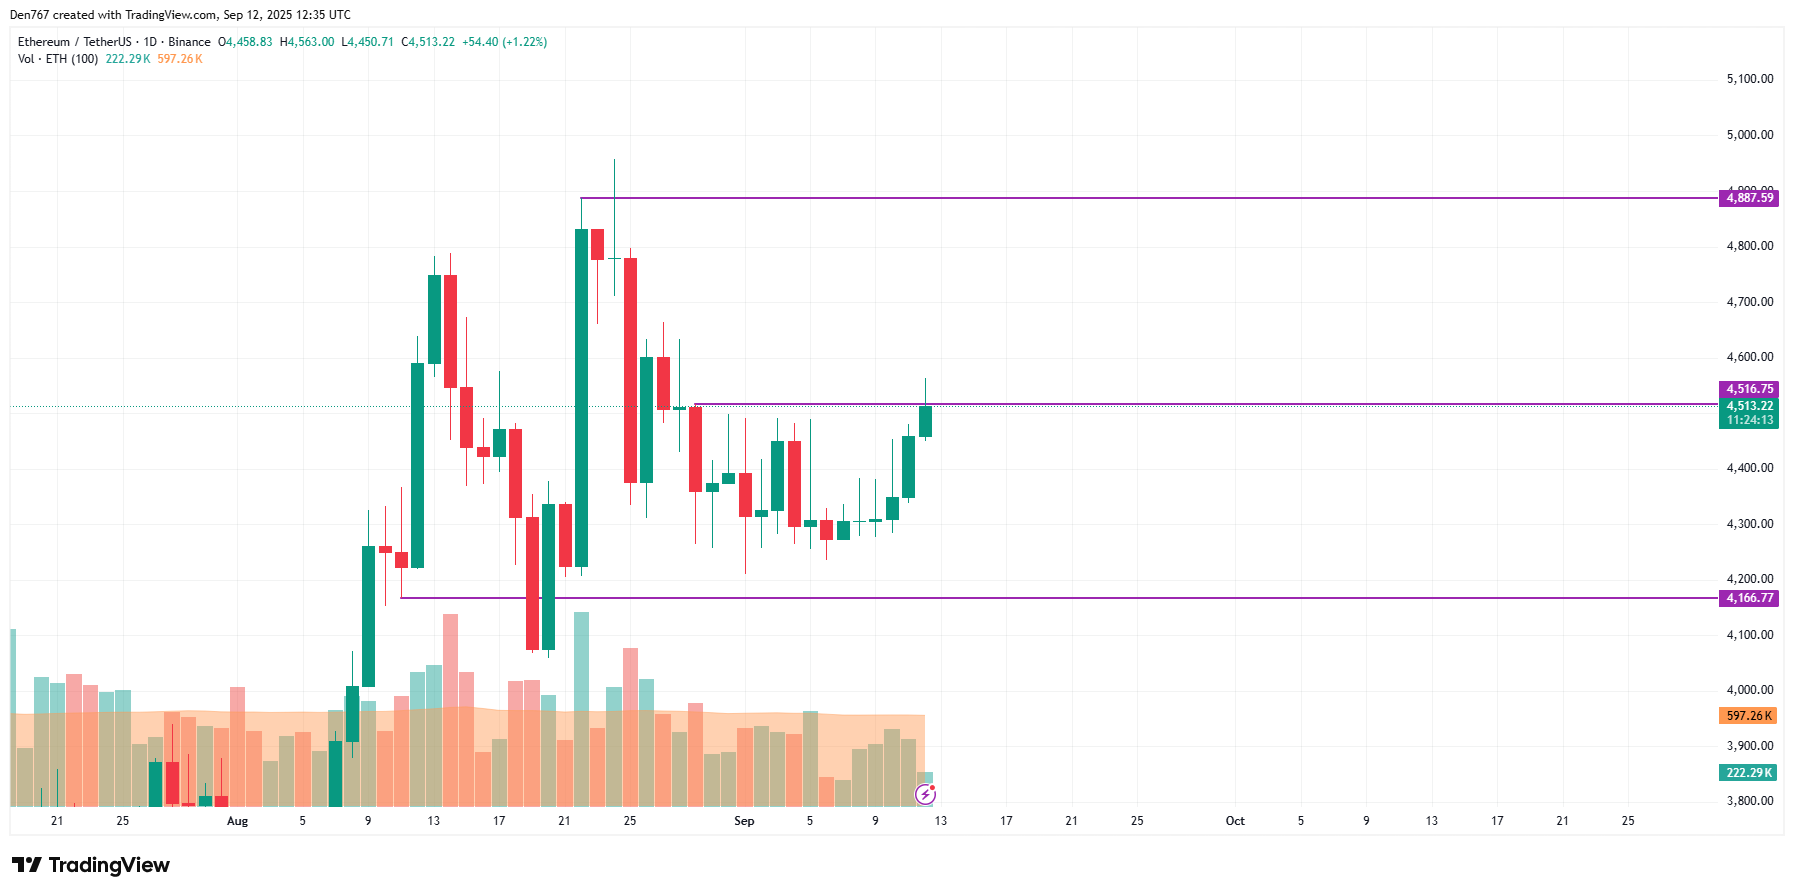
Image by TradingView
What are key support and resistance levels for ETH/USD?
Key technical levels to monitor: immediate resistance at $4,558, medium-term resistance near $4,788, immediate support at $4,516 and a stronger support band at $4,166. These levels are derived from recent price action and pivot observations on TradingView and CoinMarketCap data.
| Current price | $4,515 |
| 24h change | +1.3% |
| Immediate support | $4,450–$4,516 |
| Immediate resistance | $4,558 |
| Midterm channel | $4,166 — $4,788 |
From a midterm perspective, ETH sits in the center of a channel bounded by $4,166 and $4,788. With neither buyers nor sellers in clear control, sideways trading near current prices is the highest-probability scenario until a breakout or breakdown is confirmed.
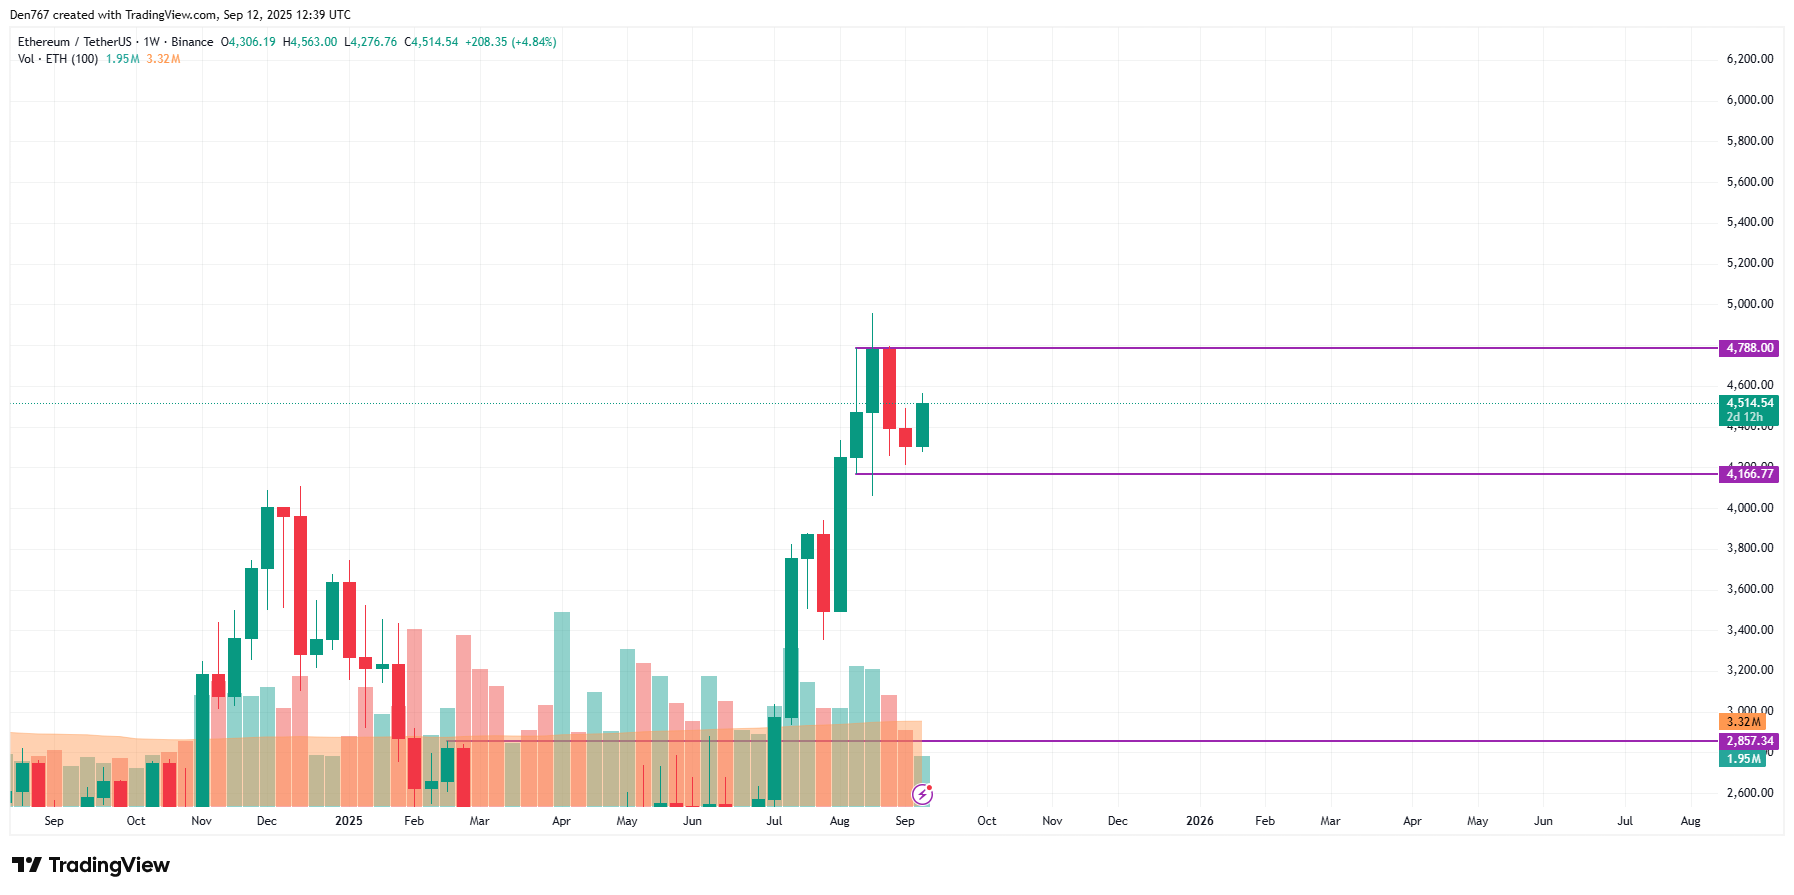
Image by TradingView
Frequently Asked Questions
Will Ethereum price drop to $4,400 soon?
A short-term drop to $4,400 is possible if the daily candle closes well below $4,516. Traders should watch daily close behavior for confirmation; a close with a long upper wick increases the likelihood of a correction to the $4,400–$4,500 range.
How should traders respond to a false breakout in ETH?
Traders can: 1) tighten stops above/below key levels, 2) avoid adding position into failed breakouts, and 3) wait for a confirmed daily close beyond support/resistance before initiating directional trades.
Key Takeaways
- Short-term view: ETH price near $4,515 with a false breakout at $4,558 — monitor daily close.
- Risk zones: Potential correction to $4,400–$4,500 if bears amplify selling.
- Midterm outlook: Trading range between $4,166 and $4,788 suggests sideways action until decisive breakout.
Conclusion
This COINOTAG report shows Ethereum price holding near $4,515 after a modest late-week rally. Technical conditions point to a cautious near-term outlook: watch $4,516 and $4,558 for confirmation. Traders should prioritize risk management and wait for daily closes before committing to new directional positions.